
Page 46 - Air Pollution Control Engineering
P. 46
01_chap_wang.qxd 05/05/2004 11:46 am Page 26
26 Lawrence K. Wang et al.
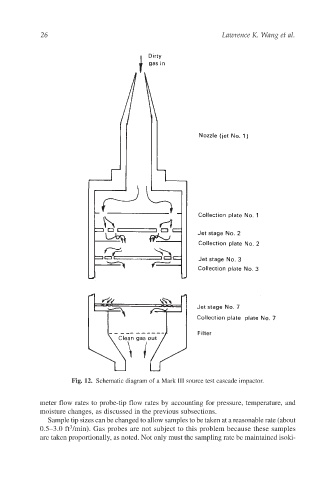
Fig. 12. Schematic diagram of a Mark III source test cascade impactor.
meter flow rates to probe-tip flow rates by accounting for pressure, temperature, and
moisture changes, as discussed in the previous subsections.
Sample tip sizes can be changed to allow samples to be taken at a reasonable rate (about
3
0.5–3.0 ft /min). Gas probes are not subject to this problem because these samples
are taken proportionally, as noted. Not only must the sampling rate be maintained isoki-