
Page 153 - Air pollution and greenhouse gases from basic concepts to engineering applications for air emission control
P. 153
5.1 Adsorption 127
The actual carbon mass needed is
m 100 48:1kg of C 4 H 10 O 100
m carbon ¼ ¼
M eq:g=100 g 40 0:128 kg of C 4 H 10 O per kg of carbon 40
¼ 939:5 kg of carbon
5.1.4 Adsorption Wave
An adsorption wave is used to determine the kinetics of adsorption for an adsorbent
column. Consider a gas stream passing through a column packed with adsorbent.
The concentration of the adsorbate in the gas before cleaning is denoted as C 0 . The
adsorption process does not take place uniformly throughout the bed. When the
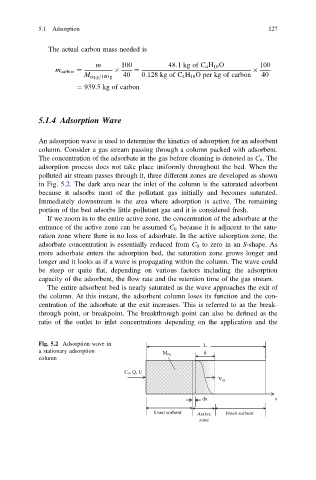
polluted air stream passes through it, three different zones are developed as shown
in Fig. 5.2. The dark area near the inlet of the column is the saturated adsorbent
because it adsorbs most of the pollutant gas initially and becomes saturated.
Immediately downstream is the area where adsorption is active. The remaining
portion of the bed adsorbs little pollutant gas and it is considered fresh.
If we zoom in to the entire active zone, the concentration of the adsorbate at the
entrance of the active zone can be assumed C 0 because it is adjacent to the satu-
ration zone where there is no loss of adsorbate. In the active adsorption zone, the
adsorbate concentration is essentially reduced from C 0 to zero in an S-shape. As
more adsorbate enters the adsorption bed, the saturation zone grows longer and
longer and it looks as if a wave is propagating within the column. The wave could
be steep or quite flat, depending on various factors including the adsorption
capacity of the adsorbent, the flow rate and the retention time of the gas stream.
The entire adsorbent bed is nearly saturated as the wave approaches the exit of
the column. At this instant, the adsorbent column loses its function and the con-
centration of the adsorbate at the exit increases. This is referred to as the break-
through point, or breakpoint. The breakthrough point can also be defined as the
ratio of the outlet to inlet concentrations depending on the application and the
Fig. 5.2 Adsorption wave in L
a stationary adsorption δ
M eq
column
C 0, Q, U
V az
dx x
Used sorbent Active Fresh sorbent
zone