Page 401 - Air pollution and greenhouse gases from basic concepts to engineering applications for air emission control
P. 401
380                                        12  Carbon Capture and Storage

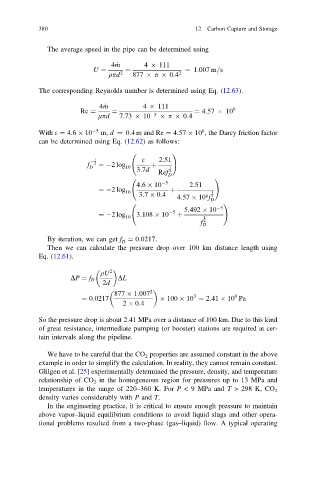
              The average speed in the pipe can be determined using

                                4 _ m    4   111
                           U ¼      ¼               ¼ 1:007 m=s
                               qpd 2  877   p   0:4 2
            The corresponding Reynolds number is determined using Eq. (12.63).

                             4 _ m       4   111                  6
                       Re ¼     ¼                      ¼ 4:57   10
                            lpd   7:73   10  5    p   0:4
                                                         6
            With e ¼ 4:6   10  5  m, d ¼ 0:4 m and Re ¼ 4:57   10 , the Darcy friction factor
            can be determined using Eq. (12.62) as follows:

                                                 !
                           1            e    2:51

                         f D  2  ¼ 2 log 10  þ  1
                                       3:7d     2
                                             Ref
                                                D
                                                             !
                                       4:6   10  5    2:51
                            ¼ 2 log             þ
                                    10                      1
                                        3:7   0:4         6 2
                                                  4:57   10 f D
                                                               !
                                                    5:492   10  5
                            ¼ 2 log 10  3:108   10  5  þ  1
                                                         f  2
                                                         D
              By iteration, we can get f ¼ 0:0217.
                                   D
              Then we can calculate the pressure drop over 100 km distance length using
            Eq. (12.61).
                                2
                             qU
                     DP ¼ f D     DL
                              2d
                                           2
                                 877   1:007           3          6
                        ¼ 0:0217               100   10 ¼ 2:41   10 Pa
                                   2   0:4
            So the pressure drop is about 2.41 MPa over a distance of 100 km. Due to this kind
            of great resistance, intermediate pumping (or booster) stations are required at cer-
            tain intervals along the pipeline.
              We have to be careful that the CO 2 properties are assumed constant in the above
            example in order to simplify the calculation. In reality, they cannot remain constant.
            Glilgen et al. [25] experimentally determined the pressure, density, and temperature
            relationship of CO 2 in the homogeneous region for pressures up to 13 MPa and
            temperatures in the range of 220–360 K. For P < 9 MPa and T > 298 K, CO 2
            density varies considerably with P and T.
              In the engineering practice, it is critical to ensure enough pressure to maintain
            above vapor–liquid equilibrium conditions to avoid liquid slugs and other opera-
            tional problems resulted from a two-phase (gas–liquid) flow. A typical operating

