
Page 431 - Air pollution and greenhouse gases from basic concepts to engineering applications for air emission control
P. 431
13.4 Separation of Nanoaerosol from the Air 411
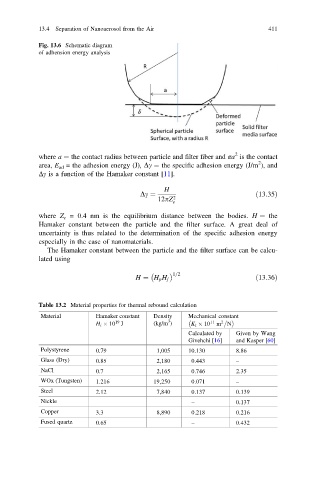
Fig. 13.6 Schematic diagram
of adhension energy analysis
2
where a ¼ the contact radius between particle and filter fiber and πa is the contact
2
area, E ad = the adhesion energy (J), Dc ¼ the specific adhesion energy (J/m ), and
Δγ is a function of the Hamaker constant [11].
H
Dc ¼ ð13:35Þ
12pZ 2
e
where Z e = 0.4 nm is the equilibrium distance between the bodies. H ¼ the
Hamaker constant between the particle and the filter surface. A great deal of
uncertainty is thus related to the determination of the specific adhesion energy
especially in the case of nanomaterials.
The Hamaker constant between the particle and the filter surface can be calcu-
lated using
1=2
H ¼ H p H f ð13:36Þ
Table 13.2 Material properties for thermal rebound calculation
Material Hamaker constant Density Mechanical constant
3
19
2
H i 10 J (kg/m ) K i 10 11 m N
Calculated by Given by Wang
Givehchi [16] and Kasper [60]
Polystyrene 0.79 1,005 10.130 8.86
Glass (Dry) 0.85 2,180 0.443 –
NaCl 0.7 2,165 0.746 2.35
WOx (Tungsten) 1.216 19,250 0.071 –
Steel 2.12 7,840 0.137 0.139
Nickle – 0.137
Copper 3.3 8,890 0.218 0.216
Fused quartz 0.65 – 0.432