Page 248 - Air and gas Drilling Field Guide 3rd Edition
P. 248

9.4 Nonfriction and Friction Illustrative Examples  239


                         1.0

                         0.8

                       (Y L /y)  0.6

                         0.4

                         0.2

                          0
                          10 –7    10 –6     10 –5    10 –4    10 –3     10 –2
                                             N  (CN )  P  0.1
                                              VL
                                                  L
                                              0.575
                                             N VG     N D  P a
                                                              P    0:1
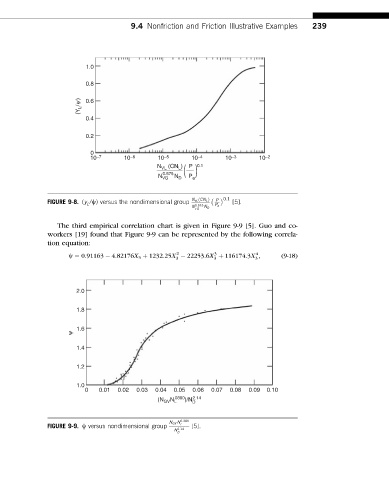
              FIGURE 9-8. (y L /c) versus the nondimensional group  [5].
                                                      N vL ðCN L Þ
                                                      N 0:575  N D  P a
                                                       vG
                 The third empirical correlation chart is given in Figure 9-9 [5]. Guo and co-
              workers [19] found that Figure 9-9 can be represented by the following correla-
              tion equation:
                                                                        4
                                                  2
                                                            3
                    c ¼ 0:91163   4:82176X 3 þ 1232:25X   22253:6X þ 116174:3X ;  (9-18)
                                                  3         3           3
                      2.0

                      1.8

                      1.6
                     ψ

                      1.4

                      1.2

                      1.0
                         0  0.01  0.02  0.03  0.04  0.05  0.06  0.07  0.08  0.09  0.10
                                             (N GV N L .0380 )/N 2.14
                                                      D

                                                N GV N 0:380
              FIGURE 9-9. c versus nondimensional group  L  [5].
                                                 N 2:14
                                                  D
   243   244   245   246   247   248   249   250   251   252   253