
Page 250 - Air and gas Drilling Field Guide 3rd Edition
P. 250
9.4 Nonfriction and Friction Illustrative Examples 241
Pressure (psia)
0 1000 2000 3000 4000
0 0
Injection
–500
–2000
Exit
–1000
–4000
Depth (ft) Inside Drill String –1500 Depth (m)
–6000
Annulus
–2000
–8000 Bit –2500
–10000 –3000
0 500 1000 1500 2000 2500 3000
2
Pressure (N/cm abs)
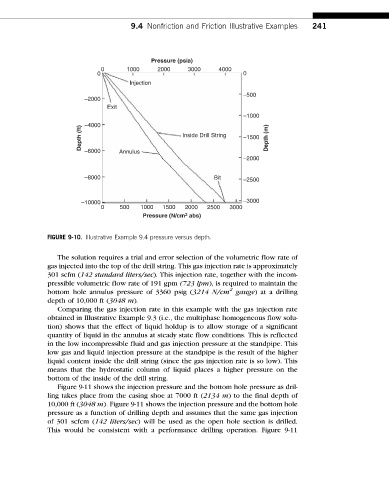
FIGURE 9-10. Illustrative Example 9.4 pressure versus depth.
The solution requires a trial and error selection of the volumetric flow rate of
gas injected into the top of the drill string. This gas injection rate is approximately
301 scfm (142 standard liters/sec). This injection rate, together with the incom-
pressible volumetric flow rate of 191 gpm (723 lpm), is required to maintain the
2
bottom hole annulus pressure of 3360 psig (3214 N/cm gauge) at a drilling
depth of 10,000 ft (3048 m).
Comparing the gas injection rate in this example with the gas injection rate
obtained in Illustrative Example 9.3 (i.e., the multiphase homogeneous flow solu-
tion) shows that the effect of liquid holdup is to allow storage of a significant
quantity of liquid in the annulus at steady state flow conditions. This is reflected
in the low incompressible fluid and gas injection pressure at the standpipe. This
low gas and liquid injection pressure at the standpipe is the result of the higher
liquid content inside the drill string (since the gas injection rate is so low). This
means that the hydrostatic column of liquid places a higher pressure on the
bottom of the inside of the drill string.
Figure 9-11 shows the injection pressure and the bottom hole pressure as dril-
ling takes place from the casing shoe at 7000 ft (2134 m) to the final depth of
10,000 ft (3048 m). Figure 9-11 shows the injection pressure and the bottom hole
pressure as a function of drilling depth and assumes that the same gas injection
of 301 scfcm (142 liters/sec) will be used as the open hole section is drilled.
This would be consistent with a performance drilling operation. Figure 9-11