
Page 294 - Aircraft Stuctures for Engineering Student
P. 294
Problems 275
If, at the same altitude, the aircraft encounters a sharp-edged vertical up-gust of
18m/s true airspeed, calculate the changes in the lift and tail load and also the
resultant load factor n.
The relevant data in the usual notation are as follows:
Wing: S = 280m’, aCL/aa = 1.5
Tail: ST = 28m2, aC~,T/aa = 2.0
Weight W = 1600000N
CM,O = - 0.01
Mean chord E = 22.8 m
At 18 300m
p = 0.116kg/m3
Am. P = 267 852N, AP = 36257N, AL = 271 931 N, n = 1.19
P.8.8 An aircraft of all up weight 145 000 N has wings of area 50 m2 and mean
chord 2.5m. For the whole aircraft CD = 0.021 + O.O41C;, for the wings
dCL/da = 4.8, for the tailplane of area 9.0m2, dCL,T/da = 2.2 allowing for the
effects of downwash: and the pitching moment coefficient about the aerodynamic
centre (of complete aircraft less tailplane) based on wing area is C,, = -0.032.
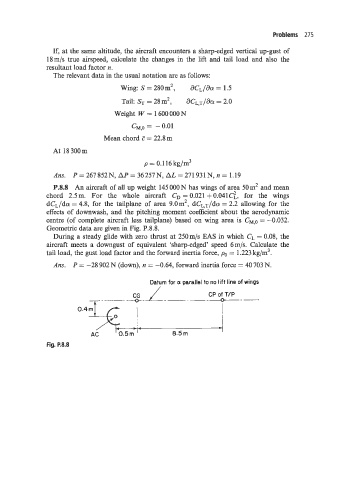
Geometric data are given in Fig. P.8.8.
During a steady glide with zero thrust at 250m/s EAS in which CL = 0.08: the
aircraft meets a downgust of equivalent ‘sharp-edged’ speed 6 m/s. Calculate the
tail load: the gust load factor and the forward inertia force, po = 1.223 kg/m3.
Ans. P = -28 902 N (down), n = -0.64, forward inertia force = 40 703 N.
Datum for a parallel to no lift line of wings
CP of TIP
_a_-
i
I
8.5 m
Fig. P.8.8