
Page 139 - Alternative Energy Systems in Building Design
P. 139
SOLAR POWER SYSTEM DESIGN CONSIDERATIONS 115
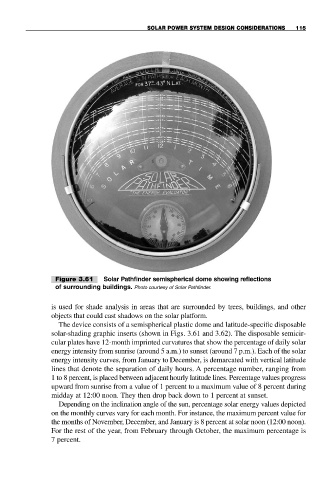
Figure 3.61 Solar Pathfinder semispherical dome showing reflections
of surrounding buildings. Photo courtesy of Solar Pathfinder.
is used for shade analysis in areas that are surrounded by trees, buildings, and other
objects that could cast shadows on the solar platform.
The device consists of a semispherical plastic dome and latitude-specific disposable
solar-shading graphic inserts (shown in Figs. 3.61 and 3.62). The disposable semicir-
cular plates have 12-month imprinted curvatures that show the percentage of daily solar
energy intensity from sunrise (around 5 a.m.) to sunset (around 7 p.m.). Each of the solar
energy intensity curves, from January to December, is demarcated with vertical latitude
lines that denote the separation of daily hours. A percentage number, ranging from
1 to 8 percent, is placed between adjacent hourly latitude lines. Percentage values progress
upward from sunrise from a value of 1 percent to a maximum value of 8 percent during
midday at 12:00 noon. They then drop back down to 1 percent at sunset.
Depending on the inclination angle of the sun, percentage solar energy values depicted
on the monthly curves vary for each month. For instance, the maximum percent value for
the months of November, December, and January is 8 percent at solar noon (12:00 noon).
For the rest of the year, from February through October, the maximum percentage is
7 percent.