
Page 140 - Alternative Energy Systems in Building Design
P. 140
116 SOLAR POWER SYSTEM PHYSICS AND TECHNOLOGIES
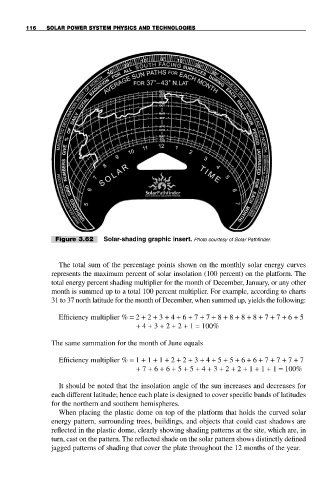
Figure 3.62 Solar-shading graphic insert. Photo courtesy of Solar Pathfinder.
The total sum of the percentage points shown on the monthly solar energy curves
represents the maximum percent of solar insolation (100 percent) on the platform. The
total energy percent shading multiplier for the month of December, January, or any other
month is summed up to a total 100 percent multiplier. For example, according to charts
31 to 37 north latitude for the month of December, when summed up, yields the following:
Efficiency multiplier % = 2 + 2 + 3 + 4 + 6 + 7 + 7 + 8 + 8 + 8 + 8 + 7 + 7 + 6 + 5
+ 4 + 3 + 2 + 2 + 1 = 100%
The same summation for the month of June equals
Efficiency multiplier % = 1 + 1 + 1 + 2 + 2 + 3 + 4 + 5 + 5 + 6 + 6 + 7 + 7 + 7 + 7
+ 7 + 6 + 6 + 5 + 5 + 4 + 3 + 2 + 2 + 1 + 1 + 1 = 100%
It should be noted that the insolation angle of the sun increases and decreases for
each different latitude; hence each plate is designed to cover specific bands of latitudes
for the northern and southern hemispheres.
When placing the plastic dome on top of the platform that holds the curved solar
energy pattern, surrounding trees, buildings, and objects that could cast shadows are
reflected in the plastic dome, clearly showing shading patterns at the site, which are, in
turn, cast on the pattern. The reflected shade on the solar pattern shows distinctly defined
jagged patterns of shading that cover the plate throughout the 12 months of the year.