
Page 203 - Alternative Energy Systems in Building Design
P. 203
ELECTRIC POWER GENERATION AND DISTRIBUTION 179
TRANSFER TOWER
POWER PLANT SUB.STN. PUMPING AND
PRODUCTION TRANSFER PIPING LOSSES,
LOSS, 45–50% 30–50%
MOTOR LOSS, 10%
TRANSMISSION AND
DISTRIBUTION LOSS, 9%
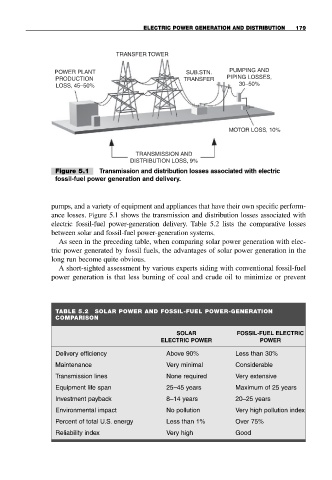
Figure 5.1 Transmission and distribution losses associated with electric
fossil-fuel power generation and delivery.
pumps, and a variety of equipment and appliances that have their own specific perform-
ance losses. Figure 5.1 shows the transmission and distribution losses associated with
electric fossil-fuel power-generation delivery. Table 5.2 lists the comparative losses
between solar and fossil-fuel power-generation systems.
As seen in the preceding table, when comparing solar power generation with elec-
tric power generated by fossil fuels, the advantages of solar power generation in the
long run become quite obvious.
A short-sighted assessment by various experts siding with conventional fossil-fuel
power generation is that less burning of coal and crude oil to minimize or prevent
TABLE 5.2 SOLAR POWER AND FOSSIL-FUEL POWER-GENERATION
COMPARISON
SOLAR FOSSIL-FUEL ELECTRIC
ELECTRIC POWER POWER
Delivery efficiency Above 90% Less than 30%
Maintenance Very minimal Considerable
Transmission lines None required Very extensive
Equipment life span 25–45 years Maximum of 25 years
Investment payback 8–14 years 20–25 years
Environmental impact No pollution Very high pollution index
Percent of total U.S. energy Less than 1% Over 75%
Reliability index Very high Good