
Page 299 - Alternative Energy Systems in Building Design
P. 299
BETZ’ LAW OF FLUID DYNAMICS 273
The graph in the figure represents the plot of the preceding equation, where the hori-
zontal axis reflects the ratio v /v , and the vertical axis is the coefficient of performance
1
2
C . By differentiating E & with respect to v /v for a given fluid speed, v , and a given area
p
1
2
2
S, we can find the maximum or minimum value for E & . The result is that E & reaches max-
imum value when v /v = 1/3 or, simply stated, outgoing velocity equals one-third of the
2
2
incoming liquid or air velocity.
Substituting the v /v ratios in the preceding formula with 1/3 results in
2
2
16 1 3
P = × × ρ Sv
max 1
27 2
Therefore, the work rate obtainable from fluid flow with area S and velocity v is
1
1
P = ρ Sv 3
2 1
In electrical engineering, the coefficient of performance is defined as the ratio of the
power output of a generator divided by the maximum power. In the case of wind tur-
bines, the coefficient of performance C equals P/P max and has a maximum value of
p
C p,max = 16 = . 0 593 , or 59.3%
27
It should be noted that coefficients of performance in general are expressed as a deci-
mal and not as a percentage.
Significant losses of power in wind energy turbines are attributed to a number of
factors, such as rotor bearing friction, heat or copper loss, and air friction losses. In
general, the C value of modern turbines used in windmills ranges from 0.4 to 0.5, which
p
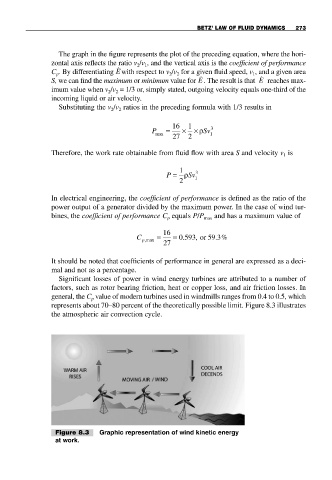
represents about 70–80 percent of the theoretically possible limit. Figure 8.3 illustrates
the atmospheric air convection cycle.
Figure 8.3 Graphic representation of wind kinetic energy
at work.