
Page 48 -
P. 48
28 CHAPTER 1 INTRODUCTION
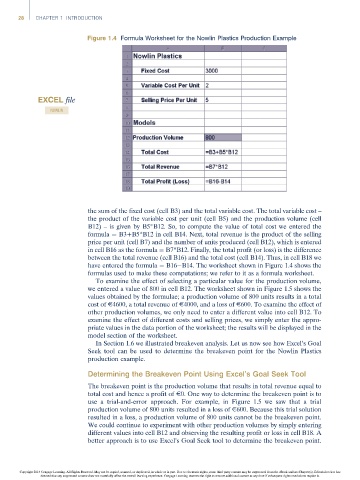
Figure 1.4 Formula Worksheet for the Nowlin Plastics Production Example
EXCEL file
NOWLIN
the sum of the fixed cost (cell B3) and the total variable cost. The total variable cost –
the product of the variable cost per unit (cell B5) and the production volume (cell
B12) – is given by B5*B12. So, to compute the value of total cost we entered the
formula ¼ B3+B5*B12 in cell B14. Next, total revenue is the product of the selling
price per unit (cell B7) and the number of units produced (cell B12), which is entered
in cell B16 as the formula ¼ B7*B12. Finally, the total profit (or loss) is the difference
between the total revenue (cell B16) and the total cost (cell B14). Thus, in cell B18 we
have entered the formula ¼ B16 B14. The worksheet shown in Figure 1.4 shows the
formulas used to make these computations; we refer to it as a formula worksheet.
To examine the effect of selecting a particular value for the production volume,
we entered a value of 800 in cell B12. The worksheet shown in Figure 1.5 shows the
values obtained by the formulae; a production volume of 800 units results in a total
cost of E4600, a total revenue of E4000, and a loss of E600. To examine the effect of
other production volumes, we only need to enter a different value into cell B12. To
examine the effect of different costs and selling prices, we simply enter the appro-
priate values in the data portion of the worksheet; the results will be displayed in the
model section of the worksheet.
In Section 1.6 we illustrated breakeven analysis. Let us now see how Excel’s Goal
Seek tool can be used to determine the breakeven point for the Nowlin Plastics
production example.
Determining the Breakeven Point Using Excel’s Goal Seek Tool
The breakeven point is the production volume that results in total revenue equal to
total cost and hence a profit of E0. One way to determine the breakeven point is to
use a trial-and-error approach. For example, in Figure 1.5 we saw that a trial
production volume of 800 units resulted in a loss of E600. Because this trial solution
resulted in a loss, a production volume of 800 units cannot be the breakeven point.
We could continue to experiment with other production volumes by simply entering
different values into cell B12 and observing the resulting profit or loss in cell B18. A
better approach is to use Excel’s Goal Seek tool to determine the breakeven point.
Copyright 2014 Cengage Learning. All Rights Reserved. May not be copied, scanned, or duplicated, in whole or in part. Due to electronic rights, some third party content may be suppressed from the eBook and/or eChapter(s). Editorial review has
deemed that any suppressed content does not materially affect the overall learning experience. Cengage Learning reserves the right to remove additional content at any time if subsequent rights restrictions require it.