
Page 481 -
P. 481
SINGLE-CHANNEL QUEUING MODEL WITH POISSON ARRIVALS AND EXPONENTIAL SERVICE TIMES 461
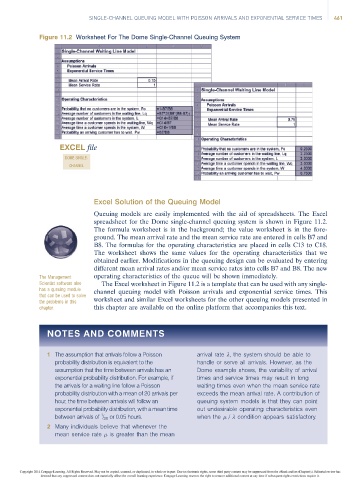
Figure 11.2 Worksheet For The Dome Single-Channel Queuing System
EXCEL file
DOME SINGLE-
CHANNEL
Excel Solution of the Queuing Model
Queuing models are easily implemented with the aid of spreadsheets. The Excel
spreadsheet for the Dome single-channel queuing system is shown in Figure 11.2.
The formula worksheet is in the background; the value worksheet is in the fore-
ground. The mean arrival rate and the mean service rate are entered in cells B7 and
B8. The formulas for the operating characteristics are placed in cells C13 to C18.
The worksheet shows the same values for the operating characteristics that we
obtained earlier. Modifications in the queuing design can be evaluated by entering
different mean arrival rates and/or mean service rates into cells B7 and B8. The new
The Management operating characteristics of the queue will be shown immediately.
Scientist software also The Excel worksheet in Figure 11.2 is a template that can be used with any single-
has a queuing module channel queuing model with Poisson arrivals and exponential service times. This
that can be used to solve
the problems in this worksheet and similar Excel worksheets for the other queuing models presented in
chapter. this chapter are available on the online platform that accompanies this text.
NOTES AND COMMENTS
1 The assumption that arrivals follow a Poisson arrival rate l, the system should be able to
probability distribution is equivalent to the handle or serve all arrivals. However, as the
assumption that the time between arrivals has an Dome example shows, the variability of arrival
exponential probability distribution. For example, if times and service times may result in long
the arrivals for a waiting line follow a Poisson waiting times even when the mean service rate
probability distribution with a mean of 20 arrivals per exceeds the mean arrival rate. A contribution of
hour, the time between arrivals will follow an queuing systemmodelsisthattheycan point
exponential probability distribution, with a mean time out undesirable operating characteristics even
1
between arrivals of / 20 or 0.05 hours. when the / l condition appears satisfactory.
2 Many individuals believe that whenever the
mean service rate is greater than the mean
Copyright 2014 Cengage Learning. All Rights Reserved. May not be copied, scanned, or duplicated, in whole or in part. Due to electronic rights, some third party content may be suppressed from the eBook and/or eChapter(s). Editorial review has
deemed that any suppressed content does not materially affect the overall learning experience. Cengage Learning reserves the right to remove additional content at any time if subsequent rights restrictions require it.