
Page 480 -
P. 480
460 CHAPTER 11 QUEUING MODELS
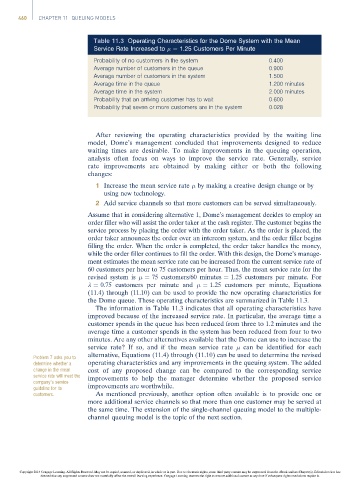
Table 11.3 Operating Characteristics for the Dome System with the Mean
Service Rate Increased to ¼ 1.25 Customers Per Minute
Probability of no customers in the system 0.400
Average number of customers in the queue 0.900
Average number of customers in the system 1.500
Average time in the queue 1.200 minutes
Average time in the system 2.000 minutes
Probability that an arriving customer has to wait 0.600
Probability that seven or more customers are in the system 0.028
After reviewing the operating characteristics provided by the waiting line
model, Dome’s management concluded that improvements designed to reduce
waiting times are desirable. To make improvements in the queuing operation,
analysts often focus on ways to improve the service rate. Generally, service
rate improvements are obtained by making either or both the following
changes:
1 Increase the mean service rate by making a creative design change or by
using new technology.
2 Add service channels so that more customers can be served simultaneously.
Assume that in considering alternative 1, Dome’s management decides to employ an
order filler who will assist the order taker at the cash register. The customer begins the
service process by placing the order with the order taker. As the order is placed, the
order taker announces the order over an intercom system, and the order filler begins
filling the order. When the order is completed, the order taker handles the money,
while the order filler continues to fill the order. With this design, the Dome’s manage-
ment estimates the mean service rate can be increased from the current service rate of
60 customers per hour to 75 customers per hour. Thus, the mean service rate for the
revised system is ¼ 75 customers/60 minutes ¼ 1.25 customers per minute. For
l ¼ 0.75 customers per minute and ¼ 1.25 customers per minute, Equations
(11.4) through (11.10) can be used to provide the new operating characteristics for
the Dome queue. These operating characteristics are summarized in Table 11.3.
The information in Table 11.3 indicates that all operating characteristics have
improved because of the increased service rate. In particular, the average time a
customer spends in the queue has been reduced from three to 1.2 minutes and the
average time a customer spends in the system has been reduced from four to two
minutes. Are any other alternatives available that the Dome can use to increase the
service rate? If so, and if the mean service rate can be identified for each
alternative, Equations (11.4) through (11.10) can be used to determine the revised
Problem 7 asks you to
determine whether a operating characteristics and any improvements in the queuing system. The added
change in the mean cost of any proposed change can be compared to the corresponding service
service rate will meet the improvements to help the manager determine whether the proposed service
company’s service
guideline for its improvements are worthwhile.
customers. As mentioned previously, another option often available is to provide one or
more additional service channels so that more than one customer may be served at
the same time. The extension of the single-channel queuing model to the multiple-
channel queuing model is the topic of the next section.
Copyright 2014 Cengage Learning. All Rights Reserved. May not be copied, scanned, or duplicated, in whole or in part. Due to electronic rights, some third party content may be suppressed from the eBook and/or eChapter(s). Editorial review has
deemed that any suppressed content does not materially affect the overall learning experience. Cengage Learning reserves the right to remove additional content at any time if subsequent rights restrictions require it.