
Page 475 -
P. 475
STRUCTURE OF A QUEUING SYSTEM 455
Suppose that the Dome has analyzed data on customer arrivals and concluded
that the mean arrival rate is 45 customers per hour. For a one-minute period, the
mean arrival rate would be l ¼ 45 customers/60 minutes ¼ 0.75 customers per
minute. We can use the following Poisson probability function to calculate the
probability of a given number of customer arrivals, x,duringaone-minute period:
x 0:75
x
e 0:75 e
PðxÞ¼ ¼ (11:2)
x! x!
The probabilities of 0, 1 and 2 customer arrivals during a one-minute period are then
calculated as:
0 0:75
ð0:75Þ e 0:75
Pð0Þ¼ ¼ e ¼ 0:4724
0!
1 0:75
ð0:75Þ e
Pð1Þ¼ ¼ 0:75e 0:75 ¼ 0:75ð0:4724Þ¼ 0:3543
1!
2 0:75
2 0:75
ð0:75Þ e ð0:75Þ e ð0:5625Þð0:4724Þ
Pð2Þ¼ ¼ ¼ ¼ 0:1329
2! 2! 2
The probability of no customers arriving in a one-minute period is 0.4724, the proba-
bility of one customer arriving in a one-minute period is 0.3543, and the probability of
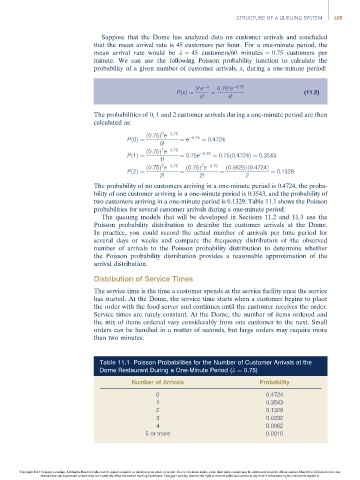
two customers arriving in a one-minute period is 0.1329. Table 11.1 shows the Poisson
probabilities for several customer arrivals during a one-minute period.
The queuing models that will be developed in Sections 11.2 and 11.3 use the
Poisson probability distribution to describe the customer arrivals at the Dome.
In practice, you could record the actual number of arrivals per time period for
several days or weeks and compare the frequency distribution of the observed
number of arrivals to the Poisson probability distribution to determine whether
the Poisson probability distribution provides a reasonable approximation of the
arrival distribution.
Distribution of Service Times
The service time is the time a customer spends at the service facility once the service
has started. At the Dome, the service time starts when a customer begins to place
the order with the food server and continues until the customer receives the order.
Service times are rarely constant. At the Dome, the number of items ordered and
the mix of items ordered vary considerably from one customer to the next. Small
orders can be handled in a matter of seconds, but large orders may require more
than two minutes.
Table 11.1 Poisson Probabilities for the Number of Customer Arrivals at the
Dome Restaurant During a One-Minute Period (l ¼ 0.75)
Number of Arrivals Probability
0 0.4724
1 0.3543
2 0.1329
3 0.0332
4 0.0062
5 or more 0.0010
Copyright 2014 Cengage Learning. All Rights Reserved. May not be copied, scanned, or duplicated, in whole or in part. Due to electronic rights, some third party content may be suppressed from the eBook and/or eChapter(s). Editorial review has
deemed that any suppressed content does not materially affect the overall learning experience. Cengage Learning reserves the right to remove additional content at any time if subsequent rights restrictions require it.