Page 478 -
P. 478
458   CHAPTER 11 QUEUING MODELS


                                       7 The probability of n units in the system:

                                                                           n

                                                                   P n ¼    P 0                     (11:10)


                                     The values of the mean arrival rate l and the mean service rate   are clearly
                                     important components in determining the operating characteristics. Equation
                                     (11.9) shows that the ratio of the mean arrival rate to the mean service rate, l/ ,
                                     provides the probability that an arriving unit has to wait because the service facility is
                                     in use. Hence, l/  is often referred to as the utilization factor for the service facility.
                                       The operating characteristics presented in Equations (11.4) through (11.10) are
                                     applicable only when the mean service rate   is greater than the mean arrival rate l –
                                     in other words, when l/ < 1. If this condition does not exist, the queue will
                                     continue to grow without limit because the service facility does not have sufficient
                                     capacity to handle the arriving units. Thus, in using Equations (11.4) through
                                     (11.10), we must have  > l.


                                     Operating Characteristics for the Dome Problem
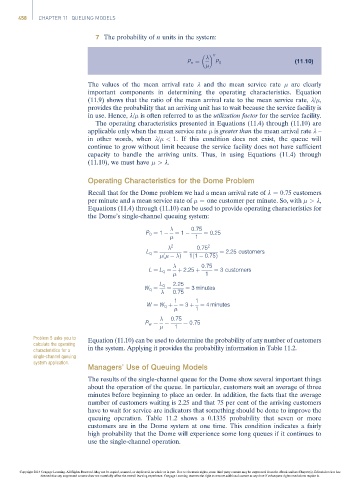
                                     Recall that for the Dome problem we had a mean arrival rate of l ¼ 0.75 customers
                                     per minute and a mean service rate of   ¼ one customer per minute. So, with  > l,
                                     Equations (11.4) through (11.10) can be used to provide operating characteristics for
                                     the Dome’s single-channel queuing system:

                                                                    0:75
                                                      P 0 ¼ 1    ¼ 1    ¼ 0:25
                                                                     1
                                                               2      0:75 2
                                                       L q ¼      ¼          ¼ 2:25 customers
                                                            ð     Þ  1ð1   0:75Þ
                                                                       0:75
                                                       L ¼ L q ¼  þ 2:25 þ  ¼ 3 customers
                                                                         1
                                                           L q  2:25
                                                      W q ¼  ¼    ¼ 3 minutes
                                                               0:75
                                                               1      1
                                                       W ¼ W q þ  ¼ 3 þ  ¼ 4 minutes
                                                                      1
                                                              0:75
                                                      P w ¼  ¼    ¼ 0:75
                                                               1
                    Problem 5 asks you to  Equation (11.10) can be used to determine the probability of any number of customers
                    calculate the operating
                    characteristics for a  in the system. Applying it provides the probability information in Table 11.2.
                    single-channel queuing
                    system application.
                                     Managers’ Use of Queuing Models

                                     The results of the single-channel queue for the Dome show several important things
                                     about the operation of the queue. In particular, customers wait an average of three
                                     minutes before beginning to place an order. In addition, the facts that the average
                                     number of customers waiting is 2.25 and that 75 per cent of the arriving customers
                                     have to wait for service are indicators that something should be done to improve the
                                     queuing operation. Table 11.2 shows a 0.1335 probability that seven or more
                                     customers are in the Dome system at one time. This condition indicates a fairly
                                     high probability that the Dome will experience some long queues if it continues to
                                     use the single-channel operation.


                Copyright 2014 Cengage Learning. All Rights Reserved. May not be copied, scanned, or duplicated, in whole or in part. Due to electronic rights, some third party content may be suppressed from the eBook and/or eChapter(s). Editorial review has
                      deemed that any suppressed content does not materially affect the overall learning experience. Cengage Learning reserves the right to remove additional content at any time if subsequent rights restrictions require it.

