
Page 489 -
P. 489
ECONOMIC ANALYSIS OF QUEUES 469
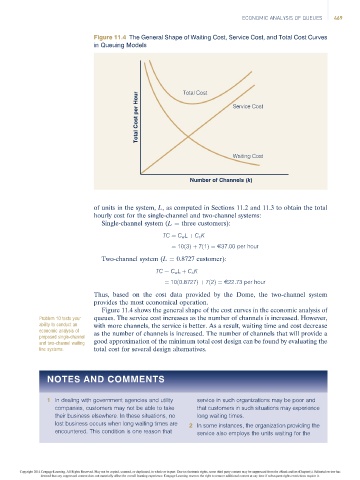
Figure 11.4 The General Shape of Waiting Cost, Service Cost, and Total Cost Curves
in Queuing Models
Total Cost per Hour Total Cost Service Cost
Waiting Cost
Number of Channels (k)
of units in the system, L, as computed in Sections 11.2 and 11.3 to obtain the total
hourly cost for the single-channel and two-channel systems:
Single-channel system (L ¼ three customers):
TC ¼ C w L þ C s K
¼ 10ð3Þþ 7ð1Þ¼ E37:00 per hour
Two-channel system (L ¼ 0.8727 customer):
TC ¼ C w L þ C s K
¼ 10ð0:8727Þþ 7ð2Þ¼ E22:73 per hour
Thus, based on the cost data provided by the Dome, the two-channel system
provides the most economical operation.
Figure 11.4 shows the general shape of the cost curves in the economic analysis of
Problem 10 tests your queues. The service cost increases as the number of channels is increased. However,
ability to conduct an with more channels, the service is better. As a result, waiting time and cost decrease
economic analysis of
proposed single-channel as the number of channels is increased. The number of channels that will provide a
and two-channel waiting good approximation of the minimum total cost design can be found by evaluating the
line systems. total cost for several design alternatives.
NOTES AND COMMENTS
1 In dealing with government agencies and utility service in such organizations may be poor and
companies, customers may not be able to take that customers in such situations may experience
their business elsewhere. In these situations, no long waiting times.
lost business occurs when long waiting times are 2 In some instances, the organization providing the
encountered. This condition is one reason that service also employs the units waiting for the
Copyright 2014 Cengage Learning. All Rights Reserved. May not be copied, scanned, or duplicated, in whole or in part. Due to electronic rights, some third party content may be suppressed from the eBook and/or eChapter(s). Editorial review has
deemed that any suppressed content does not materially affect the overall learning experience. Cengage Learning reserves the right to remove additional content at any time if subsequent rights restrictions require it.