
Page 556 -
P. 556
536 CHAPTER 12 SIMULATION
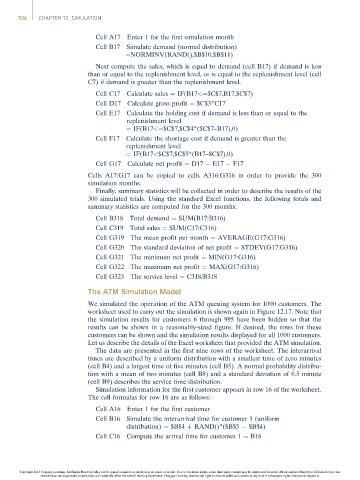
Cell A17 Enter 1 for the first simulation month
Cell B17 Simulate demand (normal distribution)
¼NORMINV(RAND(),$B$10,$B$11)
Next compute the sales, which is equal to demand (cell B17) if demand is less
than or equal to the replenishment level, or is equal to the replenishment level (cell
C7) if demand is greater than the replenishment level.
Cell C17 Calculate sales ¼ IF(B17<¼$C$7,B17,$C$7)
Cell D17 Calculate gross profit ¼ $C$3*C17
Cell E17 Calculate the holding cost if demand is less than or equal to the
replenishment level
¼ IF(B17<¼$C$7,$C$4*($C$7–B17),0)
Cell F17 Calculate the shortage cost if demand is greater than the
replenishment level
¼ IF(B17<$C$7,$C$5*(B17–$C$7),0)
Cell G17 Calculate net profit ¼ D17 E17 F17
Cells A17:G17 can be copied to cells A316:G316 in order to provide the 300
simulation months.
Finally, summary statistics will be collected in order to describe the results of the
300 simulated trials. Using the standard Excel functions, the following totals and
summary statistics are computed for the 300 months.
Cell B318 Total demand ¼ SUM(B17:B316)
Cell C319 Total sales ¼ SUM(C17:C316)
Cell G319 The mean profit per month ¼ AVERAGE(G17:G316)
Cell G320 The standard deviation of net profit ¼ STDEV(G17:G316)
Cell G321 The minimum net profit ¼ MIN(G17:G316)
Cell G322 The maximum net profit ¼ MAX(G17:G316)
Cell G323 The service level ¼ C318/B318
The ATM Simulation Model
We simulated the operation of the ATM queuing system for 1000 customers. The
worksheet used to carry out the simulation is shown again in Figure 12.17. Note that
the simulation results for customers 6 through 995 have been hidden so that the
results can be shown in a reasonably-sized figure. If desired, the rows for these
customers can be shown and the simulation results displayed for all 1000 customers.
Let us describe the details of the Excel worksheet that provided the ATM simulation.
The data are presented in the first nine rows of the worksheet. The interarrival
times are described by a uniform distribution with a smallest time of zero minutes
(cell B4) and a largest time of five minutes (cell B5). A normal probability distribu-
tion with a mean of two minutes (cell B8) and a standard deviation of 0.5 minute
(cell B9) describes the service time distribution.
Simulation information for the first customer appears in row 16 of the worksheet.
The cell formulas for row 16 are as follows:
Cell A16 Enter 1 for the first customer
Cell B16 Simulate the interarrival time for customer 1 (uniform
distribution) ¼ $B$4 þ RAND()*($B$5 $B$4)
Cell C16 Compute the arrival time for customer 1 ¼ B16
Copyright 2014 Cengage Learning. All Rights Reserved. May not be copied, scanned, or duplicated, in whole or in part. Due to electronic rights, some third party content may be suppressed from the eBook and/or eChapter(s). Editorial review has
deemed that any suppressed content does not materially affect the overall learning experience. Cengage Learning reserves the right to remove additional content at any time if subsequent rights restrictions require it.