
Page 555 -
P. 555
SIMULATION WITH EXCEL 535
The Butler Inventory Simulation Model
We simulated the Butler inventory operation for 300 months. The worksheet
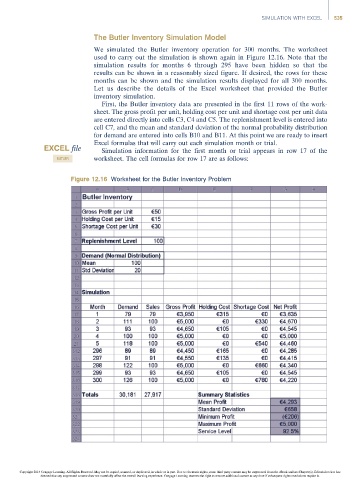
used to carry out the simulation is shown again in Figure 12.16. Note that the
simulation results for months 6 through 295 have been hidden so that the
results can be shown in a reasonably sized figure. If desired, the rows for these
months can be shown and the simulation results displayed for all 300 months.
Let us describe the details of the Excel worksheet that provided the Butler
inventory simulation.
First, the Butler inventory data are presented in the first 11 rows of the work-
sheet. The gross profit per unit, holding cost per unit and shortage cost per unit data
are entered directly into cells C3, C4 and C5. The replenishment level is entered into
cell C7, and the mean and standard deviation of the normal probability distribution
for demand are entered into cells B10 and B11. At this point we are ready to insert
Excel formulas that will carry out each simulation month or trial.
EXCEL file Simulation information for the first month or trial appears in row 17 of the
BUTLER worksheet. The cell formulas for row 17 are as follows:
Figure 12.16 Worksheet for the Butler Inventory Problem
Copyright 2014 Cengage Learning. All Rights Reserved. May not be copied, scanned, or duplicated, in whole or in part. Due to electronic rights, some third party content may be suppressed from the eBook and/or eChapter(s). Editorial review has
deemed that any suppressed content does not materially affect the overall learning experience. Cengage Learning reserves the right to remove additional content at any time if subsequent rights restrictions require it.