
Page 550 -
P. 550
530 CHAPTER 12 SIMULATION
agent is normally distributed with a mean of four minutes and a standard deviation of one
minute. Use a two-channel queuing simulation model to evaluate this queuing system. Use
the worksheet design shown in Figure 12.13. The cell formula ¼ 4*LN(RAND()) can be
used to generate the interarrival times. Simulate the operation of the telephone reservation
system for 600 customers. Discard the first 100 customers, and collect data over the next
500 customers.
a. Calculate the mean interarrival time and the mean service time. If your simulation model
is operating correctly, both of these should have means of approximately four minutes.
b. What is the mean customer waiting time for this system?
c. Use the ¼COUNTIF function to determine the number of customers who have to wait
for a reservation agent. What percentage of the customers have to wait?
CASE PROBLEM 1 Dunes Golf Course
unes Golf Course is one of the top golf on both the front and back nine at noon. To enable
D courses in the Scottish Highlands. The course all players to complete 18 holes before darkness,
offers some of the best views available. Dunes the last two afternoon foursomes start their rounds
targets the upper end of the golf market and in at 1:21 P. M. Under this plan, Dunes can sell a maxi-
the peak spring golfing season, charges green fees mum of 20 afternoon tee times.
of £160 per person and golf cart fees of £20 per Last year Dunes was able to sell every morning
person. tee time available for every day of the spring golf
Dunes takes reservations for tee times for groups season. The same result is anticipated for the
of four players (foursome) starting at 7:30 each coming year. Afternoon tee times, however, are
morning. Foursomes start at the same time on both generally more difficult to sell. An analysis of the
the front nine and the back nine of the course, with sales data for last year enabled Dunes to develop
a new group teeing off every nine minutes. The the probability distribution of sales for the after-
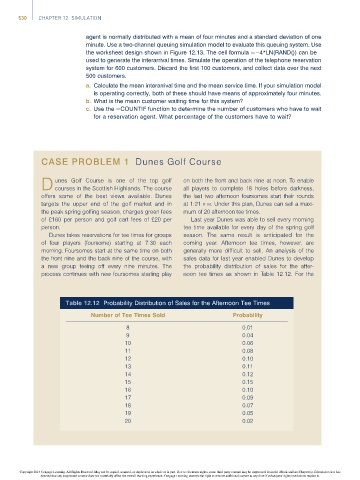
process continues with new foursomes starting play noon tee times as shown in Table 12.12. For the
Table 12.12 Probability Distribution of Sales for the Afternoon Tee Times
Number of Tee Times Sold Probability
8 0.01
9 0.04
10 0.06
11 0.08
12 0.10
13 0.11
14 0.12
15 0.15
16 0.10
17 0.09
18 0.07
19 0.05
20 0.02
Copyright 2014 Cengage Learning. All Rights Reserved. May not be copied, scanned, or duplicated, in whole or in part. Due to electronic rights, some third party content may be suppressed from the eBook and/or eChapter(s). Editorial review has
deemed that any suppressed content does not materially affect the overall learning experience. Cengage Learning reserves the right to remove additional content at any time if subsequent rights restrictions require it.