
Page 549 -
P. 549
OTHER SIMULATION ISSUES 529
28(100) ¼ E2800 per flight. The airline operations office has asked for an
evaluation of an overbooking strategy where they would accept 32 reservations
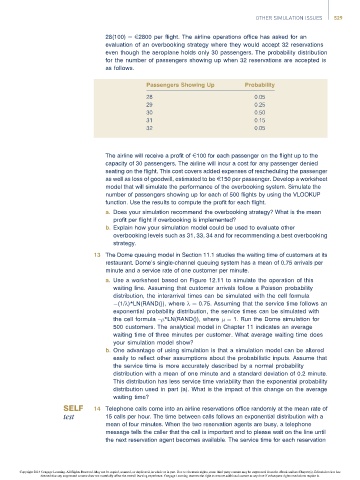
even though the aeroplane holds only 30 passengers. The probability distribution
for the number of passengers showing up when 32 reservations are accepted is
as follows.
Passengers Showing Up Probability
28 0.05
29 0.25
30 0.50
31 0.15
32 0.05
The airline will receive a profit of E100 for each passenger on the flight up to the
capacity of 30 passengers. The airline will incur a cost for any passenger denied
seating on the flight. This cost covers added expenses of rescheduling the passenger
as well as loss of goodwill, estimated to be E150 per passenger. Develop a worksheet
model that will simulate the performance of the overbooking system. Simulate the
number of passengers showing up for each of 500 flights by using the VLOOKUP
function. Use the results to compute the profit for each flight.
a. Does your simulation recommend the overbooking strategy? What is the mean
profit per flight if overbooking is implemented?
b. Explain how your simulation model could be used to evaluate other
overbooking levels such as 31, 33, 34 and for recommending a best overbooking
strategy.
13 The Dome queuing model in Section 11.1 studies the waiting time of customers at its
restaurant. Dome’s single-channel queuing system has a mean of 0.75 arrivals per
minute and a service rate of one customer per minute.
a. Use a worksheet based on Figure 12.11 to simulate the operation of this
waiting line. Assuming that customer arrivals follow a Poisson probability
distribution, the interarrival times can be simulated with the cell formula
(1/l)*LN(RAND()), where l ¼ 0.75. Assuming that the service time follows an
exponential probability distribution, the service times can be simulated with
the cell formula – *LN(RAND()), where ¼ 1. Run the Dome simulation for
500 customers. The analytical model in Chapter 11 indicates an average
waiting time of three minutes per customer. What average waiting time does
your simulation model show?
b. One advantage of using simulation is that a simulation model can be altered
easily to reflect other assumptions about the probabilistic inputs. Assume that
the service time is more accurately described by a normal probability
distribution with a mean of one minute and a standard deviation of 0.2 minute.
This distribution has less service time variability than the exponential probability
distribution used in part (a). What is the impact of this change on the average
waiting time?
14 Telephone calls come into an airline reservations office randomly at the mean rate of
15 calls per hour. The time between calls follows an exponential distribution with a
mean of four minutes. When the two reservation agents are busy, a telephone
message tells the caller that the call is important and to please wait on the line until
the next reservation agent becomes available. The service time for each reservation
Copyright 2014 Cengage Learning. All Rights Reserved. May not be copied, scanned, or duplicated, in whole or in part. Due to electronic rights, some third party content may be suppressed from the eBook and/or eChapter(s). Editorial review has
deemed that any suppressed content does not materially affect the overall learning experience. Cengage Learning reserves the right to remove additional content at any time if subsequent rights restrictions require it.