Page 547 -
P. 547
OTHER SIMULATION ISSUES  527


                                        C                               10                            0.10
                                                                        12                            0.25
                                                                        14                            0.40
                                                                        16                            0.20
                                                                        18                            0.05
                                        D                               8                             0.60
                                                                        10                            0.40


                                      a. Provide the base-case, worst-case and best-case calculations for the time to complete
                                        the project.
                                      b. Use the random numbers 0.1778, 0.9617, 0.6849 and 0.4503 to simulate the completion
                                        time of the project in weeks.
                                      c. Discuss how simulation could be used to estimate the probability the project can be
                                        completed in 35 weeks or less.
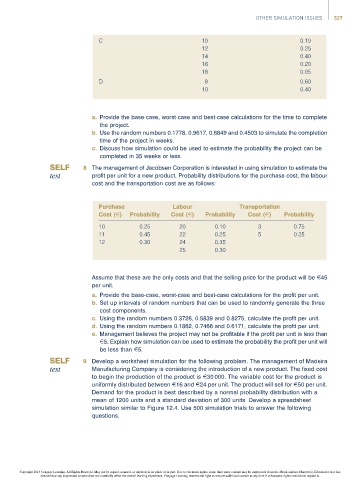
                                   8 The management of Jacobsen Corporation is interested in using simulation to estimate the
                                      profit per unit for a new product. Probability distributions for the purchase cost, the labour
                                      cost and the transportation cost are as follows:


                                        Purchase               Labour              Transportation
                                        Cost (E)  Probability  Cost (E)  Probability  Cost (E)   Probability
                                        10          0.25         20         0.10         3          0.75
                                        11          0.45         22         0.25         5          0.25
                                        12          0.30         24         0.35
                                                                 25         0.30


                                      Assume that these are the only costs and that the selling price for the product will be E45
                                      per unit.
                                      a. Provide the base-case, worst-case and best-case calculations for the profit per unit.
                                      b. Set up intervals of random numbers that can be used to randomly generate the three
                                        cost components.
                                      c. Using the random numbers 0.3726, 0.5839 and 0.8275, calculate the profit per unit.
                                      d. Using the random numbers 0.1862, 0.7466 and 0.6171, calculate the profit per unit.
                                      e. Management believes the project may not be profitable if the profit per unit is less than
                                        E5. Explain how simulation can be used to estimate the probability the profit per unit will
                                        be less than E5.
                                   9 Develop a worksheet simulation for the following problem. The management of Madeira
                                      Manufacturing Company is considering the introduction of a new product. The fixed cost
                                      to begin the production of the product is E30 000. The variable cost for the product is
                                      uniformly distributed between E16 and E24 per unit. The product will sell for E50 per unit.
                                      Demand for the product is best described by a normal probability distribution with a
                                      mean of 1200 units and a standard deviation of 300 units. Develop a spreadsheet
                                      simulation similar to Figure 12.4. Use 500 simulation trials to answer the following
                                      questions.


                Copyright 2014 Cengage Learning. All Rights Reserved. May not be copied, scanned, or duplicated, in whole or in part. Due to electronic rights, some third party content may be suppressed from the eBook and/or eChapter(s). Editorial review has
                      deemed that any suppressed content does not materially affect the overall learning experience. Cengage Learning reserves the right to remove additional content at any time if subsequent rights restrictions require it.

