
Page 26 - An Introduction to Microelectromechanical Systems Engineering
P. 26
Applications and Markets 5
dollars by 2010 [2–7]. The expected growth stems from technical innovations and
acceptance of the technology by an increasing number of end users and customers.
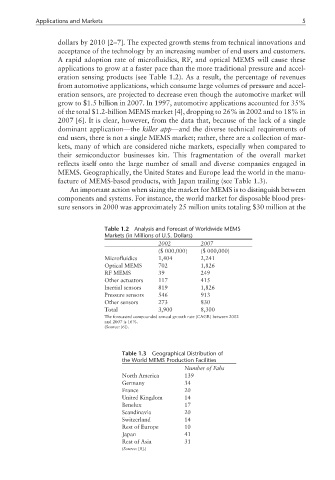
A rapid adoption rate of microfluidics, RF, and optical MEMS will cause these
applications to grow at a faster pace than the more traditional pressure and accel-
eration sensing products (see Table 1.2). As a result, the percentage of revenues
from automotive applications, which consume large volumes of pressure and accel-
eration sensors, are projected to decrease even though the automotive market will
grow to $1.5 billion in 2007. In 1997, automotive applications accounted for 35%
of the total $1.2-billion MEMS market [4], dropping to 26% in 2002 and to 18% in
2007 [6]. It is clear, however, from the data that, because of the lack of a single
dominant application—the killer app—and the diverse technical requirements of
end users, there is not a single MEMS market; rather, there are a collection of mar-
kets, many of which are considered niche markets, especially when compared to
their semiconductor businesses kin. This fragmentation of the overall market
reflects itself onto the large number of small and diverse companies engaged in
MEMS. Geographically, the United States and Europe lead the world in the manu-
facture of MEMS-based products, with Japan trailing (see Table 1.3).
An important action when sizing the market for MEMS is to distinguish between
components and systems. For instance, the world market for disposable blood pres-
sure sensors in 2000 was approximately 25 million units totaling $30 million at the
Table 1.2 Analysis and Forecast of Worldwide MEMS
Markets (in Millions of U.S. Dollars)
2002 2007
($ 000,000) ($ 000,000)
Microfluidics 1,404 2,241
Optical MEMS 702 1,826
RF MEMS 39 249
Other actuators 117 415
Inertial sensors 819 1,826
Pressure sensors 546 913
Other sensors 273 830
Total 3,900 8,300
The forecasted compounded annual growth rate (CAGR) between 2002
and 2007 is 16%.
(Source: [6]).
Table 1.3 Geographical Distribution of
the World MEMS Production Facilities
Number of Fabs
North America 139
Germany 34
France 20
United Kingdom 14
Benelux 17
Scandinavia 20
Switzerland 14
Rest of Europe 10
Japan 41
Rest of Asia 31
(Source: [8].)