
Page 83 - Analog and Digital Filter Design
P. 83
80 Analog and Digital Filter Design
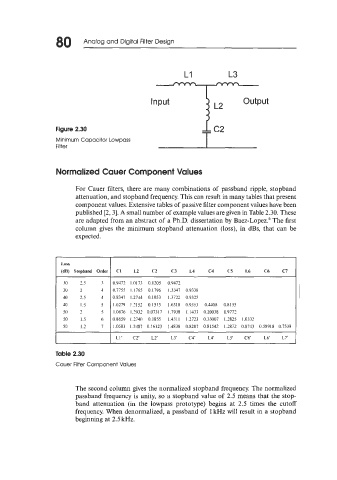
L1 L3
Input output
3 L2
-r I
Figure 2.30 c2
I
Minimum Capacitor Lowpass
Filter I
Normalized Cauer Component Values
For Cauer filters, there are many combinations of passband ripple, stopband
attenuation, and stopband frequency. This can result in many tables that present
component values. Extensive tables of passive filter component values have been
published [2,3]. A small number of example values are given in Table 2.30. These
are adapted from an abstract of a Ph.D. dissertation by Baez-Lopez.6 The first
column gives the minimum stopband attenuation (loss), in dBs, that can be
expected.
~ ~~
Loss
(dB) Stopband Order CI L2 C2 C3 L4 C4 C5 L6 C6 C7
30 2.5 3 0.9472 1.0173 0.1205 0.9472
30 2 1 0.7755 I. I765 0. I796 1.3347 0.9338
40 2.5 1 0.8347 I.27&t 0. I053 1.3722 0.9325
40 1.5 5 1.0279 1.2152 0.1513 1.6318 0.9353 0.4408 0.8155
50 2 5 1.0876 1.2932 0.073 17 1.7938 1.1433 0.20038 0.9772
50 1.5 6 0.8659 1.2740 0.1855 1.431 I 1.2723 0.33007 1.2825 1.0332
50 1.2 7 1.0503 1.2487 0.16123 1.4838 0.8287 0.81542 1.2872 0.8743 0.58918 0.7539
~~
LI' c2' Lz' L3' c4' L4' L5' C6' L6' L7'
Table 2.30
Cauer Filter Component Values
The second column gives the normalized stopband frequency. The normalized
passband frequency is unity, so a stopband value of 2.5 means that the stop-
band attenuation (in the lowpass prototype) begins at 2.5 times the cutoff
frequency. When denormalized, a passband of 1 kHz will result in a stopband
beginning at 2.5 kHz.