Page 60 - Analysis and Design of Machine Elements
P. 60

Analysis and Design of Machine Elements
                    38
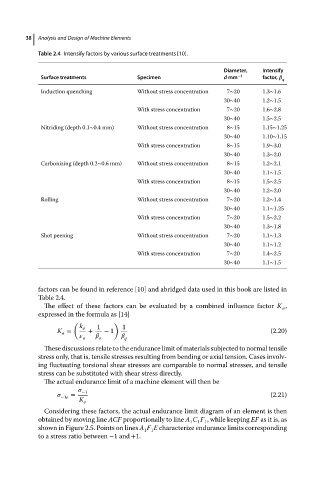
                       Table 2.4 Intensify factors by various surface treatments [10].
                                                                             Diameter,  Intensify
                        Surface treatments          Specimen                 d mm −1    factor,     q
                        Induction quenching         Without stress concentration  7∼20  1.3∼1.6
                                                                             30∼40      1.2∼1.5
                                                    With stress concentration  7∼20     1.6∼2.8
                                                                             30∼40      1.5∼2.5
                        Nitriding (depth 0.1∼0.4 mm)  Without stress concentration  8∼15  1.15∼1.25
                                                                             30∼40      1.10∼1.15
                                                    With stress concentration  8∼15     1.9∼3.0
                                                                             30∼40      1.3∼2.0
                        Carbonizing (depth 0.2∼0.6 mm)  Without stress concentration  8∼15  1.2∼2.1
                                                                             30∼40      1.1∼1.5
                                                    With stress concentration  8∼15     1.5∼2.5
                                                                             30∼40      1.2∼2.0
                        Rolling                     Without stress concentration  7∼20  1.2∼1.4
                                                                             30∼40      1.1∼1.25
                                                    With stress concentration  7∼20     1.5∼2.2
                                                                             30∼40      1.3∼1.8
                        Shot peening                Without stress concentration  7∼20  1.1∼1.3

                                                                             30∼40      1.1∼1.2
                                                    With stress concentration  7∼20     1.4∼2.5
                                                                             30∼40      1.1∼1.5


                       factors can be found in reference [10] and abridged data used in this book are listed in
                       Table 2.4.
                         The effect of these factors can be evaluated by a combined influence factor K ,
                                                                                                
                       expressed in the formula as [14]
                                  (          )
                                   k     1      1
                             K =      +   − 1                                             (2.20)
                                
                                                 
                                                q
                         These discussions relate to the endurance limit of materials subjected to normal tensile
                       stress only, that is, tensile stresses resulting from bending or axial tension. Cases involv-
                       ing fluctuating torsional shear stresses are comparable to normal stresses, and tensile
                       stress can be substituted with shear stress directly.
                         The actual endurance limit of a machine element will then be
                                      −1
                                 =                                                        (2.21)
                              −1e
                                   K
                                      
                         Considering these factors, the actual endurance limit diagram of an element is then
                       obtained by moving line ACF proportionally to line A C F , while keeping EF as it is, as
                                                                     1 1
                                                                   1
                       shown in Figure 2.5. Points on lines A F E characterize endurance limits corresponding
                                                      1 1
                       to a stress ratio between −1and +1.
   55   56   57   58   59   60   61   62   63   64   65