
Page 32 - Analysis, Synthesis and Design of Chemical Processes, Third Edition
P. 32
Block flow diagrams were introduced early in the chemical engineering curriculum. In the first course in
material and energy balances, often an initial step was to convert a word problem into a simple block
diagram. This diagram consisted of a series of blocks representing different equipment or unit operations
that were connected by input and output streams. Important information such as operating temperatures,
pressures, conversions, and yield was included on the diagram along with flowrates and some chemical
compositions. However, the diagram did not include any details of equipment within any of the blocks.
The block flow diagram can take one of two forms. First, a block flow diagram may be drawn for a single
process. Alternatively, a block flow diagram may be drawn for a complete chemical complex involving
many different chemical processes. We differentiate between these two types of diagram by calling the
first a block flow process diagram and the second a block flow plant diagram.
1.1.1 Block Flow Process Diagram
An example of a block flow process diagram is shown in Figure 1.1, and the process illustrated is
described below.
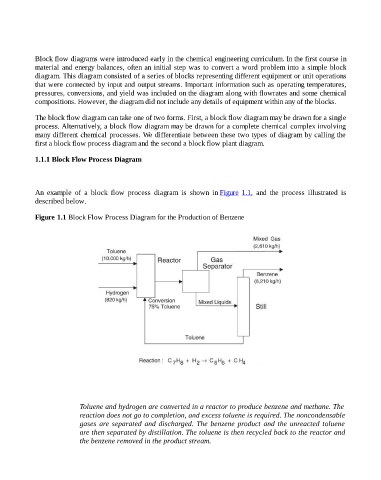
Figure 1.1 Block Flow Process Diagram for the Production of Benzene
Toluene and hydrogen are converted in a reactor to produce benzene and methane. The
reaction does not go to completion, and excess toluene is required. The noncondensable
gases are separated and discharged. The benzene product and the unreacted toluene
are then separated by distillation. The toluene is then recycled back to the reactor and
the benzene removed in the product stream.