
Page 320 - Analysis, Synthesis and Design of Chemical Processes, Third Edition
P. 320
When an acceptable rate for i and n is substituted, a negative EAOC indicates the investment is acceptable
(because a negative cost is the same as a positive savings). Use of EAOC is demonstrated in Example
10.14.
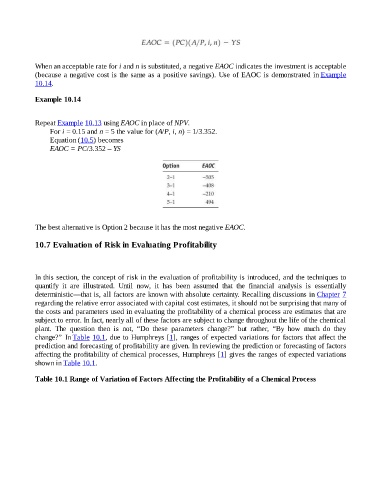
Example 10.14
Repeat Example 10.13 using EAOC in place of NPV.
For i = 0.15 and n = 5 the value for (A/P, i, n) = 1/3.352.
Equation (10.5) becomes
EAOC = PC/3.352 – YS
The best alternative is Option 2 because it has the most negative EAOC.
10.7 Evaluation of Risk in Evaluating Profitability
In this section, the concept of risk in the evaluation of profitability is introduced, and the techniques to
quantify it are illustrated. Until now, it has been assumed that the financial analysis is essentially
deterministic—that is, all factors are known with absolute certainty. Recalling discussions in Chapter 7
regarding the relative error associated with capital cost estimates, it should not be surprising that many of
the costs and parameters used in evaluating the profitability of a chemical process are estimates that are
subject to error. In fact, nearly all of these factors are subject to change throughout the life of the chemical
plant. The question then is not, “Do these parameters change?” but rather, “By how much do they
change?” In Table 10.1, due to Humphreys [1], ranges of expected variations for factors that affect the
prediction and forecasting of profitability are given. In reviewing the prediction or forecasting of factors
affecting the profitability of chemical processes, Humphreys [1] gives the ranges of expected variations
shown in Table 10.1.
Table 10.1 Range of Variation of Factors Affecting the Profitability of a Chemical Process