
Page 322 - Analysis, Synthesis and Design of Chemical Processes, Third Edition
P. 322
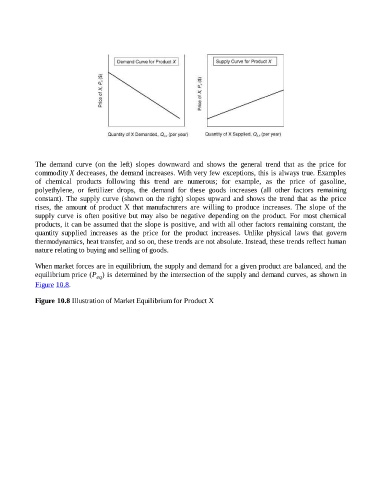
The  demand  curve  (on  the  left)  slopes  downward  and  shows  the  general  trend  that  as  the  price  for
                    commodity X decreases, the demand increases. With very few exceptions, this is always true. Examples
                    of  chemical  products  following  this  trend  are  numerous;  for  example,  as  the  price  of  gasoline,
                    polyethylene,  or  fertilizer  drops,  the  demand  for  these  goods  increases  (all  other  factors  remaining
                    constant). The supply curve (shown on the right) slopes upward and shows the trend that as the price
                    rises,  the  amount  of  product  X  that  manufacturers  are  willing  to  produce  increases.  The  slope  of  the
                    supply curve is often positive but may also be negative depending on the product. For most chemical

                    products, it can be assumed that the slope is positive, and with all other factors remaining constant, the
                    quantity  supplied  increases  as  the  price  for  the  product  increases.  Unlike  physical  laws  that  govern
                    thermodynamics, heat transfer, and so on, these trends are not absolute. Instead, these trends reflect human
                    nature relating to buying and selling of goods.


                    When market forces are in equilibrium, the supply and demand for a given product are balanced, and the
                    equilibrium price (P ) is determined by the intersection of the supply and demand curves, as shown in
                                            eq
                    Figure 10.8.


                    Figure 10.8 Illustration of Market Equilibrium for Product X