
Page 326 - Analysis, Synthesis and Design of Chemical Processes, Third Edition
P. 326
It should be noted that the quantification of risk in no way eliminates uncertainty. Rather, by quantifying it,
a better feel can be developed for how a project’s profitability may vary. Therefore, more informed and
rational decisions regarding whether to build a new plant can be made. However, the ultimate decision to
invest in a new chemical process always involves some element of risk.
Scenario Analysis. Returning to Example 10.1 regarding the profitability analysis for a new chemical
plant, assume that, as the result of previous experience with similar chemicals and some forecasting of
supply and demand for this new product, it is believed that the product price may vary in the range –20%
to +5%, the capital investment may vary between –20% and +30%, and the cost of manufacturing may
vary in the range –10% to +10%. How can these uncertainties be quantified?
One way to quantify uncertainty is via a scenario analysis. In this analysis, the best- and worst-case
scenarios are considered and compared with the base case, which has already been calculated. The
values for the three parameters for the two cases are given in Table 10.3.
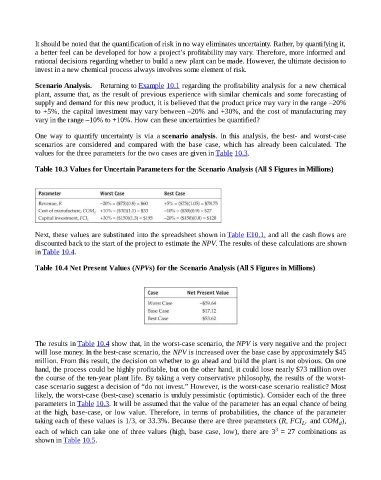
Table 10.3 Values for Uncertain Parameters for the Scenario Analysis (All $ Figures in Millions)
Next, these values are substituted into the spreadsheet shown in Table E10.1, and all the cash flows are
discounted back to the start of the project to estimate the NPV. The results of these calculations are shown
in Table 10.4.
Table 10.4 Net Present Values (NPVs) for the Scenario Analysis (All $ Figures in Millions)
The results in Table 10.4 show that, in the worst-case scenario, the NPV is very negative and the project
will lose money. In the best-case scenario, the NPV is increased over the base case by approximately $45
million. From this result, the decision on whether to go ahead and build the plant is not obvious. On one
hand, the process could be highly profitable, but on the other hand, it could lose nearly $73 million over
the course of the ten-year plant life. By taking a very conservative philosophy, the results of the worst-
case scenario suggest a decision of “do not invest.” However, is the worst-case scenario realistic? Most
likely, the worst-case (best-case) scenario is unduly pessimistic (optimistic). Consider each of the three
parameters in Table 10.3. It will be assumed that the value of the parameter has an equal chance of being
at the high, base-case, or low value. Therefore, in terms of probabilities, the chance of the parameter
taking each of these values is 1/3, or 33.3%. Because there are three parameters (R, FCI , and COM ),
L
d
3
each of which can take one of three values (high, base case, low), there are 3 = 27 combinations as
shown in Table 10.5.