
Page 327 - Analysis, Synthesis and Design of Chemical Processes, Third Edition
P. 327
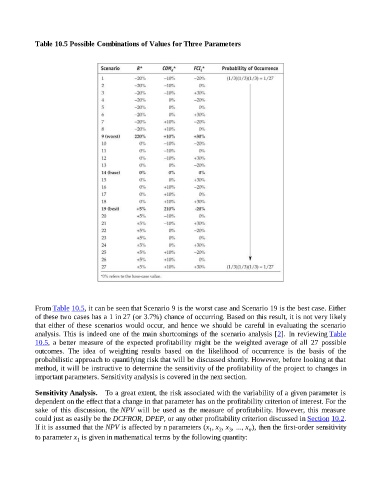
Table 10.5 Possible Combinations of Values for Three Parameters


                    From Table 10.5, it can be seen that Scenario 9 is the worst case and Scenario 19 is the best case. Either
                    of these two cases has a 1 in 27 (or 3.7%) chance of occurring. Based on this result, it is not very likely
                    that either of these scenarios would occur, and hence we should be careful in evaluating the scenario
                    analysis. This is indeed one of the main shortcomings of the scenario analysis [2].  In  reviewing Table
                    10.5,  a  better  measure  of  the  expected  profitability  might  be  the  weighted  average  of  all  27  possible
                    outcomes.  The  idea  of  weighting  results  based  on  the  likelihood  of  occurrence  is  the  basis  of  the
                    probabilistic approach to quantifying risk that will be discussed shortly. However, before looking at that
                    method, it will be instructive to determine the sensitivity of the profitability of the project to changes in
                    important parameters. Sensitivity analysis is covered in the next section.


                    Sensitivity Analysis.   To a great extent, the risk associated with the variability of a given parameter is
                    dependent on the effect that a change in that parameter has on the profitability criterion of interest. For the
                    sake  of  this  discussion,  the NPV  will  be  used  as  the  measure  of  profitability.  However,  this  measure
                    could just as easily be the DCFROR, DPEP, or any other profitability criterion discussed in Section 10.2.
                    If it is assumed that the NPV is affected by n parameters (x , x , x , ..., x ), then the first-order sensitivity
                                                                                       1   2   3       n
                    to parameter x  is given in mathematical terms by the following quantity:
                                    1