
Page 329 - Analysis, Synthesis and Design of Chemical Processes, Third Edition
P. 329
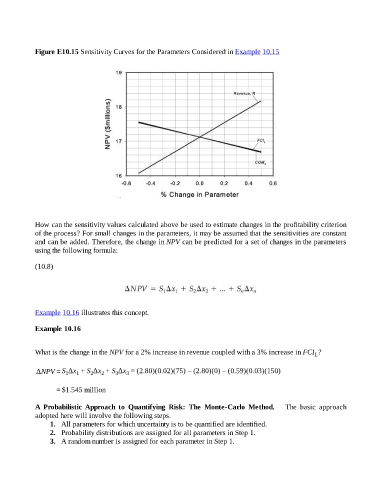
Figure E10.15 Sensitivity Curves for the Parameters Considered in Example 10.15


                    How can the sensitivity values calculated above be used to estimate changes in the profitability criterion
                    of the process? For small changes in the parameters, it may be assumed that the sensitivities are constant
                    and can be added. Therefore, the change in NPV can be predicted for a set of changes in the parameters
                    using the following formula:


                    (10.8)


                    Example 10.16 illustrates this concept.


                    Example 10.16


                    What is the change in the NPV for a 2% increase in revenue coupled with a 3% increase in FCI ?
                                                                                                                                L


                    ΔNPV = S Δx  + S Δx  + S Δx  = (2.80)(0.02)(75) – (2.80)(0) – (0.59)(0.03)(150)
                                         2
                                    1
                                1
                                                       3
                                                   3
                                              2
                            = $1.545 million
                    A  Probabilistic  Approach  to  Quantifying  Risk:  The  Monte-Carlo  Method.      The  basic  approach
                    adopted here will involve the following steps.
                          1.   All parameters for which uncertainty is to be quantified are identified.
                          2.   Probability distributions are assigned for all parameters in Step 1.
                          3.   A random number is assigned for each parameter in Step 1.