
Page 325 - Analysis, Synthesis and Design of Chemical Processes, Third Edition
P. 325
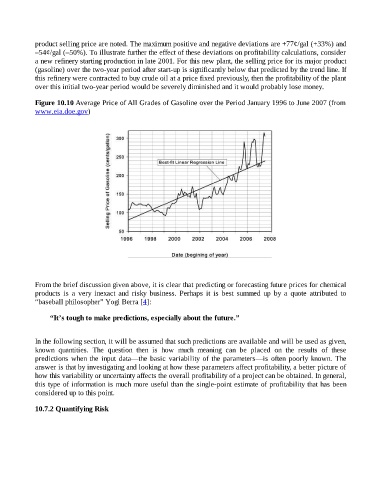
product selling price are noted. The maximum positive and negative deviations are +77¢/gal (+33%) and
                    –54¢/gal (–50%). To illustrate further the effect of these deviations on profitability calculations, consider
                    a new refinery starting production in late 2001. For this new plant, the selling price for its major product
                    (gasoline) over the two-year period after start-up is significantly below that predicted by the trend line. If
                    this refinery were contracted to buy crude oil at a price fixed previously, then the profitability of the plant
                    over this initial two-year period would be severely diminished and it would probably lose money.


                    Figure 10.10 Average Price of All Grades of Gasoline over the Period January 1996 to June 2007 (from
                    www.eia.doe.gov)


                    From the brief discussion given above, it is clear that predicting or forecasting future prices for chemical
                    products  is  a  very  inexact  and  risky  business.  Perhaps  it  is  best  summed  up  by  a  quote  attributed  to
                    “baseball philosopher” Yogi Berra [4]:


                          “It’s tough to make predictions, especially about the future.”


                    In the following section, it will be assumed that such predictions are available and will be used as given,
                    known  quantities.  The  question  then  is  how  much  meaning  can  be  placed  on  the  results  of  these
                    predictions  when  the  input  data—the  basic  variability  of  the  parameters—is  often  poorly  known.  The
                    answer is that by investigating and looking at how these parameters affect profitability, a better picture of
                    how this variability or uncertainty affects the overall profitability of a project can be obtained. In general,
                    this type of information is much more useful than the single-point estimate of profitability that has been
                    considered up to this point.


                    10.7.2 Quantifying Risk