
Page 328 - Analysis, Synthesis and Design of Chemical Processes, Third Edition
P. 328
(10.6)
where the partial derivative is taken with respect to x , while holding all other parameters constant at
1
their mean value. The sensitivity, S , is sometimes called a sensitivity coefficient. In general, this
1
quantity is too complicated to obtain via analytical differentiation; hence, it is obtained by changing the
parameter by a small amount and observing the subsequent change in the NPV, or
(10.7)
In Example 10.15, Example 10.1 is revisited to illustrate how the sensitivities of the revenue, cost of
manufacturing, and fixed capital investment on the NPV are calculated.
Example 10.15
For the chemical process considered in Example 10.1, calculate the sensitivity of R, COM , and FCI and
L
d
plot these sensitivities with respect to the NPV.
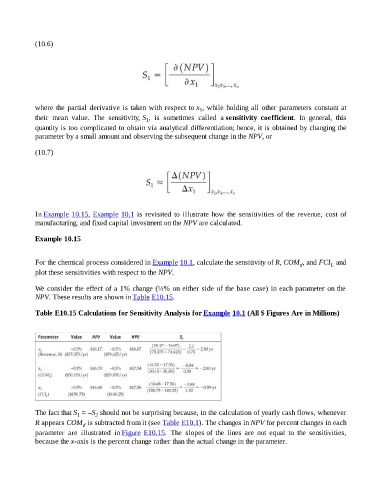
We consider the effect of a 1% change (½% on either side of the base case) in each parameter on the
NPV. These results are shown in Table E10.15.
Table E10.15 Calculations for Sensitivity Analysis for Example 10.1 (All $ Figures Are in Millions)
The fact that S = –S should not be surprising because, in the calculation of yearly cash flows, whenever
2
1
R appears COM is subtracted from it (see Table E10.1). The changes in NPV for percent changes in each
d
parameter are illustrated in Figure E10.15. The slopes of the lines are not equal to the sensitivities,
because the x-axis is the percent change rather than the actual change in the parameter.