
Page 331 - Analysis, Synthesis and Design of Chemical Processes, Third Edition
P. 331
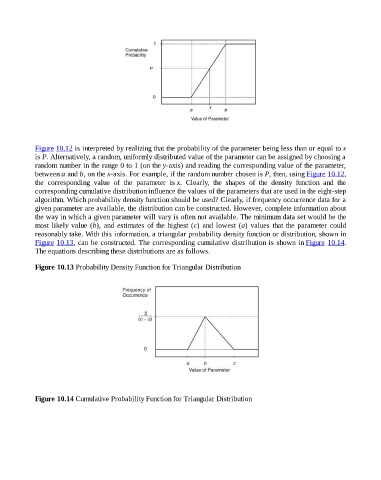
Figure 10.12 is interpreted by realizing that the probability of the parameter being less than or equal to x
                    is P. Alternatively, a random, uniformly distributed value of the parameter can be assigned by choosing a
                    random number in the range 0 to 1 (on the y-axis) and reading the corresponding value of the parameter,
                    between a and b, on the x-axis. For example, if the random number chosen is P, then, using Figure 10.12,
                    the  corresponding  value  of  the  parameter  is x.  Clearly,  the  shapes  of  the  density  function  and  the

                    corresponding cumulative distribution influence the values of the parameters that are used in the eight-step
                    algorithm. Which probability density function should be used? Clearly, if frequency occurrence data for a
                    given parameter are available, the distribution can be constructed. However, complete information about
                    the way in which a given parameter will vary is often not available. The minimum data set would be the
                    most likely value (b), and estimates of the highest (c)  and  lowest  (a)  values  that  the  parameter  could
                    reasonably take. With this information, a triangular probability density function or distribution, shown in
                    Figure 10.13, can be constructed. The corresponding cumulative distribution is shown in Figure  10.14.
                    The equations describing these distributions are as follows.


                    Figure 10.13 Probability Density Function for Triangular Distribution


                    Figure 10.14 Cumulative Probability Function for Triangular Distribution