
Page 335 - Analysis, Synthesis and Design of Chemical Processes, Third Edition
P. 335
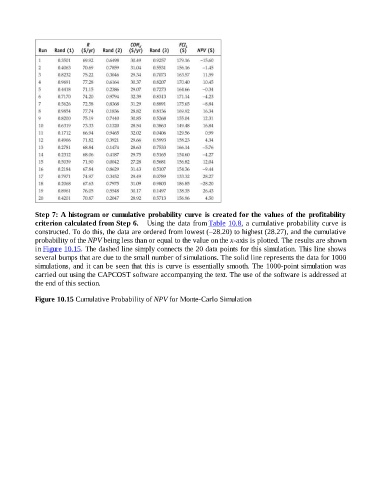
Step 7: A histogram or cumulative probability curve is created for the values of the profitability
                    criterion calculated from Step 6.   Using the data from Table 10.8, a cumulative probability curve is
                    constructed. To do this, the data are ordered from lowest (–28.20) to highest (28.27), and the cumulative
                    probability of the NPV being less than or equal to the value on the x-axis is plotted. The results are shown
                    in Figure 10.15. The dashed line simply connects the 20 data points for this simulation. This line shows

                    several bumps that are due to the small number of simulations. The solid line represents the data for 1000
                    simulations, and it can be seen that this is curve is essentially smooth. The 1000-point simulation was
                    carried out using the CAPCOST software accompanying the text. The use of the software is addressed at
                    the end of this section.


                    Figure 10.15 Cumulative Probability of NPV for Monte-Carlo Simulation