
Page 337 - Analysis, Synthesis and Design of Chemical Processes, Third Edition
P. 337
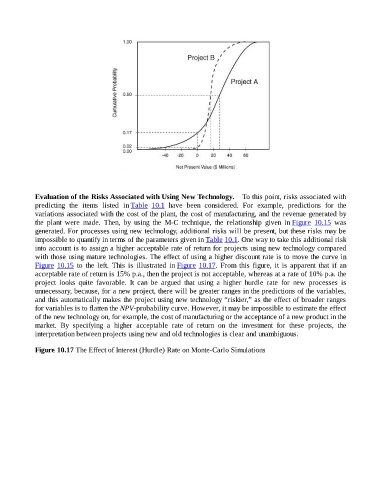
Evaluation of the Risks Associated with Using New Technology.    To this point, risks associated with
                    predicting  the  items  listed  in Table  10.1  have  been  considered.  For  example,  predictions  for  the
                    variations associated with the cost of the plant, the cost of manufacturing, and the revenue generated by
                    the  plant  were  made.  Then,  by  using  the  M-C  technique,  the  relationship  given  in Figure  10.15  was
                    generated. For processes using new technology, additional risks will be present, but these risks may be
                    impossible to quantify in terms of the parameters given in Table 10.1. One way to take this additional risk
                    into account is to assign a higher acceptable rate of return for projects using new technology compared
                    with those using mature technologies. The effect of using a higher discount rate is to move the curve in
                    Figure  10.15  to  the  left.  This  is  illustrated  in Figure  10.17.  From  this  figure,  it  is  apparent  that  if  an

                    acceptable rate of return is 15% p.a., then the project is not acceptable, whereas at a rate of 10% p.a. the
                    project  looks  quite  favorable.  It  can  be  argued  that  using  a  higher  hurdle  rate  for  new  processes  is
                    unnecessary, because, for a new project, there will be greater ranges in the predictions of the variables,
                    and this automatically makes the project using new technology “riskier,” as the effect of broader ranges
                    for variables is to flatten the NPV-probability curve. However, it may be impossible to estimate the effect
                    of the new technology on, for example, the cost of manufacturing or the acceptance of a new product in the
                    market.  By  specifying  a  higher  acceptable  rate  of  return  on  the  investment  for  these  projects,  the
                    interpretation between projects using new and old technologies is clear and unambiguous.


                    Figure 10.17 The Effect of Interest (Hurdle) Rate on Monte-Carlo Simulations