
Page 336 - Analysis, Synthesis and Design of Chemical Processes, Third Edition
P. 336
Step 8: The results of Step 7 are used to analyze the profitability of the project. From Figure 10.15,
it can be seen that there is about a 38% chance that the project will not be profitable. The median NPV is
about $5 million, and only about 21% of the values calculated lie above $17.12 million, which is the NPV
calculated for the base case, using the most likely values of R, COM , and FCI .
d
L
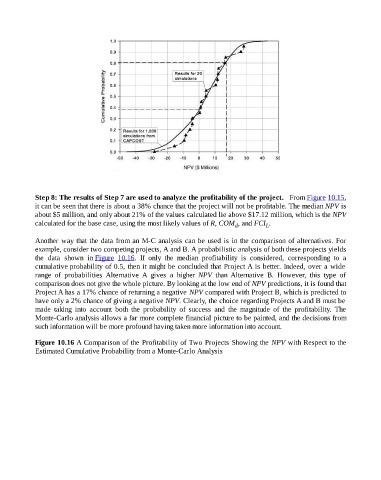
Another way that the data from an M-C analysis can be used is in the comparison of alternatives. For
example, consider two competing projects, A and B. A probabilistic analysis of both these projects yields
the data shown in Figure 10.16. If only the median profitability is considered, corresponding to a
cumulative probability of 0.5, then it might be concluded that Project A is better. Indeed, over a wide
range of probabilities Alternative A gives a higher NPV than Alternative B. However, this type of
comparison does not give the whole picture. By looking at the low end of NPV predictions, it is found that
Project A has a 17% chance of returning a negative NPV compared with Project B, which is predicted to
have only a 2% chance of giving a negative NPV. Clearly, the choice regarding Projects A and B must be
made taking into account both the probability of success and the magnitude of the profitability. The
Monte-Carlo analysis allows a far more complete financial picture to be painted, and the decisions from
such information will be more profound having taken more information into account.
Figure 10.16 A Comparison of the Profitability of Two Projects Showing the NPV with Respect to the
Estimated Cumulative Probability from a Monte-Carlo Analysis