
Page 333 - Analysis, Synthesis and Design of Chemical Processes, Third Edition
P. 333
Step 1: All the parameters for which uncertainty is to be quantified are identified. Returning to
Example 10.1, historical data suggest that there is uncertainty in the predictions for revenue (R), cost of
manufacturing (COM ), and fixed capital investment (FCI ).
d L
Step 2: Probability distributions are assigned for all parameters in Step 1. All the uncertainties
associated with these parameters are assumed to follow triangular distributions with the properties given
in Table 10.6.
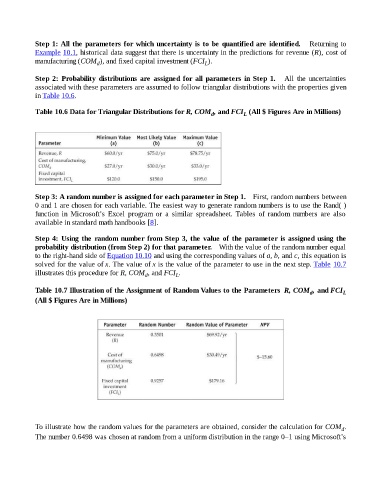
Table 10.6 Data for Triangular Distributions for R, COM , and FCI (All $ Figures Are in Millions)
d L
Step 3: A random number is assigned for each parameter in Step 1. First, random numbers between
0 and 1 are chosen for each variable. The easiest way to generate random numbers is to use the Rand( )
function in Microsoft’s Excel program or a similar spreadsheet. Tables of random numbers are also
available in standard math handbooks [8].
Step 4: Using the random number from Step 3, the value of the parameter is assigned using the
probability distribution (from Step 2) for that parameter. With the value of the random number equal
to the right-hand side of Equation 10.10 and using the corresponding values of a, b, and c, this equation is
solved for the value of x. The value of x is the value of the parameter to use in the next step. Table 10.7
illustrates this procedure for R, COM , and FCI .
L
d
Table 10.7 Illustration of the Assignment of Random Values to the Parameters R, COM , and FCI L
d
(All $ Figures Are in Millions)
To illustrate how the random values for the parameters are obtained, consider the calculation for COM .
d
The number 0.6498 was chosen at random from a uniform distribution in the range 0–1 using Microsoft’s