
Page 321 - Analysis, Synthesis and Design of Chemical Processes, Third Edition
P. 321
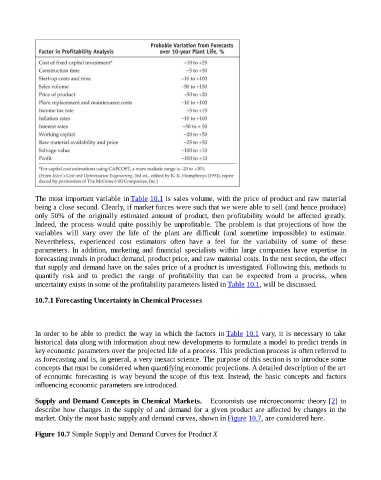
The most important variable in Table 10.1 is sales volume, with the price of product and raw material
                    being a close second. Clearly, if market forces were such that we were able to sell (and hence produce)
                    only  50%  of  the  originally  estimated  amount  of  product,  then  profitability  would  be  affected  greatly.

                    Indeed,  the  process  would  quite  possibly  be  unprofitable.  The  problem  is  that  projections of  how  the
                    variables  will  vary  over  the  life  of  the  plant  are  difficult  (and  sometime  impossible)  to  estimate.
                    Nevertheless,  experienced  cost  estimators  often  have  a  feel  for  the  variability  of  some  of  these
                    parameters.  In  addition,  marketing  and  financial  specialists  within  large  companies  have  expertise  in
                    forecasting trends in product demand, product price, and raw material costs. In the next section, the effect
                    that supply and demand have on the sales price of a product is investigated. Following this, methods to
                    quantify  risk  and  to  predict  the  range  of  profitability  that  can  be  expected  from  a  process,  when
                    uncertainty exists in some of the profitability parameters listed in Table 10.1, will be discussed.


                    10.7.1 Forecasting Uncertainty in Chemical Processes


                    In order to be able to predict the way in which the factors in Table 10.1 vary, it is necessary to take
                    historical data along with information about new developments to formulate a model to predict trends in
                    key economic parameters over the projected life of a process. This prediction process is often referred to
                    as forecasting and is, in general, a very inexact science. The purpose of this section is to introduce some
                    concepts that must be considered when quantifying economic projections. A detailed description of the art
                    of  economic  forecasting  is  way  beyond  the scope  of  this  text.  Instead,  the  basic  concepts  and  factors
                    influencing economic parameters are introduced.


                    Supply and Demand Concepts in Chemical Markets.   Economists use microeconomic theory [2]  to
                    describe how changes in the supply of and demand for a given product are affected by changes in the
                    market. Only the most basic supply and demand curves, shown in Figure 10.7, are considered here.


                    Figure 10.7 Simple Supply and Demand Curves for Product X