
Page 160 - Analytical Electrochemistry 2d Ed - Jospeh Wang
P. 160
5-1 PRINCIPLES OF POTENTIOMETRIC MEASUREMENTS 145
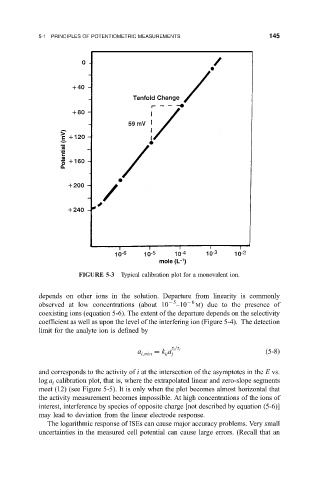
FIGURE 5-3 Typical calibration plot for a monovalent ion.
depends on other ions in the solution. Departure from linearity is commonly
observed at low concentrations (about 10 5 ±10 6 M) due to the presence of
coexisting ions (equation 5-6). The extent of the departure depends on the selectivity
coef®cient as well as upon the level of the interfering ion (Figure 5-4). The detection
limit for the analyte ion is de®ned by
a i;min k a z i =z j
5-8
ij j
and corresponds to the activity of i at the intersection of the asymptotes in the E vs.
log a calibration plot, that is, where the extrapolated linear and zero-slope segments
i
meet (12) (see Figure 5-5). It is only when the plot becomes almost horizontal that
the activity measurement becomes impossible. At high concentrations of the ions of
interest, interference by species of opposite charge [not described by equation (5-6)]
may lead to deviation from the linear electrode response.
The logarithmic response of ISEs can cause major accuracy problems. Very small
uncertainties in the measured cell potential can cause large errors. (Recall that an