
Page 78 - Analytical Electrochemistry 2d Ed - Jospeh Wang
P. 78
3-2 POLAROGRAPHY 63
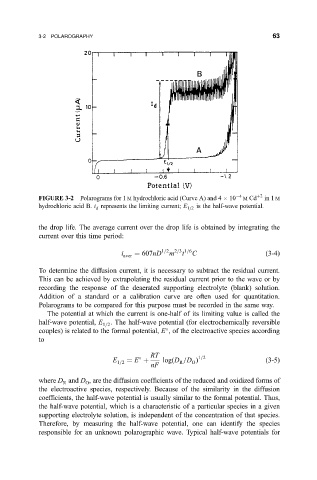
FIGURE 3-2 Polarograms for 1 M hydrochloric acid (Curve A) and 4 10 4 M Cd 2 in 1 M
hydrochloric acid B. i represents the limiting current; E 1=2 is the half-wave potential.
d
the drop life. The average current over the drop life is obtained by integrating the
current over this time period:
i aver 607nD 1=2 m 2=3 1=6 C
3-4
t
To determine the diffusion current, it is necessary to subtract the residual current.
This can be achieved by extrapolating the residual current prior to the wave or by
recording the response of the deaerated supporting electrolyte (blank) solution.
Addition of a standard or a calibration curve are often used for quantitation.
Polarograms to be compared for this purpose must be recorded in the same way.
The potential at which the current is one-half of its limiting value is called the
half-wave potential, E 1=2 . The half-wave potential (for electrochemically reversible
couples) is related to the formal potential, E , of the electroactive species according
to
RT 1=2
E 1=2 E log
D =D
3-5
R
O
nF
where D and D , are the diffusion coef®cients of the reduced and oxidized forms of
R
O
the electroactive species, respectively. Because of the similarity in the diffusion
coef®cients, the half-wave potential is usually similar to the formal potential. Thus,
the half-wave potential, which is a characteristic of a particular species in a given
supporting electrolyte solution, is independent of the concentration of that species.
Therefore, by measuring the half-wave potential, one can identify the species
responsible for an unknown polarographic wave. Typical half-wave potentials for