
Page 81 - Analytical Electrochemistry 2d Ed - Jospeh Wang
P. 81
66 CONTROLLED-POTENTIAL TECHNIQUES
The latter processes (e.g., hydrogen evolution and mercury oxidation) are those that
limit the working potential range. In acidic solutions, the negative background limit
shifts by approximately 59 mV per pH unit to more positive potentials with
decreasing pH. Within the working potential window, the charging current is the
major component of the background (which limits the detection limit). It is the
current required to charge the electrode±solution interface (which acts as a capacitor)
upon changing the potential or the electrode area (see Section 1-3). Thus, the
charging current is present in all conventional polarographic experiments, regardless
of the purity of reagents. Because of the negligible potential change during the drop
life, the charging associated with the potential scan can be ignored. The value of the
polarographic charging current thus depends on the time change of the electrode
area:
dq dA
i
E E pzc C dl
3-11
c
dt dt
By substituting the derivative of the area with time (from equation 3-2) one obtains
2=3 1=3
i 0:00567
E E pzc C m t
3-12
c
dl
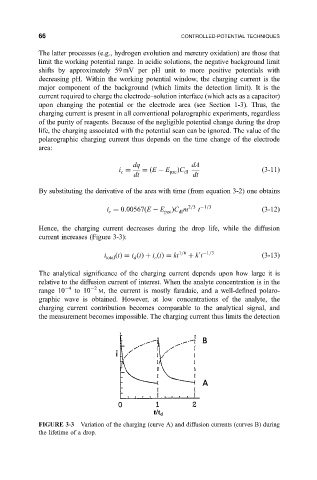
Hence, the charging current decreases during the drop life, while the diffusion
current increases (Figure 3-3):
0 1=3
i
t i
t i
t kt 1=6 k t
3-13
total d c
The analytical signi®cance of the charging current depends upon how large it is
relative to the diffusion current of interest. When the analyte concentration is in the
range 10 4 to 10 2 M, the current is mostly faradaic, and a well-de®ned polaro-
graphic wave is obtained. However, at low concentrations of the analyte, the
charging current contribution becomes comparable to the analytical signal, and
the measurement becomes impossible. The charging current thus limits the detection
FIGURE 3-3 Variation of the charging (curve A) and diffusion currents (curves B) during
the lifetime of a drop.