
Page 86 - Analytical Electrochemistry 2d Ed - Jospeh Wang
P. 86
3-3 PULSE VOLTAMMETRY 71
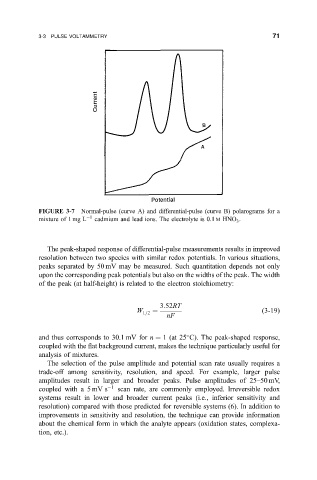
FIGURE 3-7 Normal-pulse (curve A) and differential-pulse (curve B) polarograms for a
mixture of 1 mg L 1 cadmium and lead ions. The electrolyte is 0.1 M HNO .
3
The peak-shaped response of differential-pulse measurements results in improved
resolution between two species with similar redox potentials. In various situations,
peaks separated by 50 mV may be measured. Such quantitation depends not only
upon the corresponding peak potentials but also on the widths of the peak. The width
of the peak (at half-height) is related to the electron stoichiometry:
3:52RT
W 1=2
3-19
nF
and thus corresponds to 30.1 mV for n 1 (at 25 C). The peak-shaped response,
coupled with the ¯at background current, makes the technique particularly useful for
analysis of mixtures.
The selection of the pulse amplitude and potential scan rate usually requires a
trade-off among sensitivity, resolution, and speed. For example, larger pulse
amplitudes result in larger and broader peaks. Pulse amplitudes of 25±50 mV,
coupled with a 5 mV s 1 scan rate, are commonly employed. Irreversible redox
systems result in lower and broader current peaks (i.e., inferior sensitivity and
resolution) compared with those predicted for reversible systems (6). In addition to
improvements in sensitivity and resolution, the technique can provide information
about the chemical form in which the analyte appears (oxidation states, complexa-
tion, etc.).