
Page 85 - Analytical Electrochemistry 2d Ed - Jospeh Wang
P. 85
70 CONTROLLED-POTENTIAL TECHNIQUES
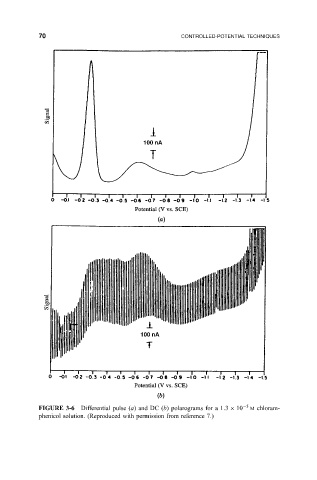
FIGURE 3-6 Differential pulse
a and DC
b polarograms for a 1:3 10 5 M chloram-
phenicol solution. (Reproduced with permission from reference 7.)