
Page 87 - Analytical Electrochemistry 2d Ed - Jospeh Wang
P. 87
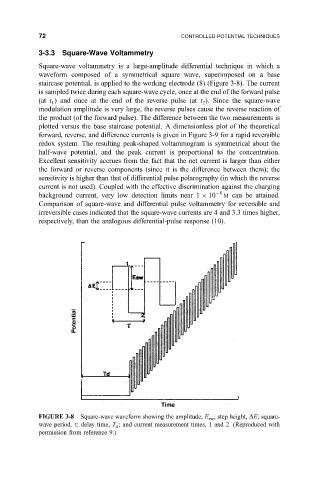
72                                     CONTROLLED-POTENTIAL TECHNIQUES

            3-3.3  Square-Wave Voltammetry
            Square-wave voltammetry is a large-amplitude differential technique in which a
            waveform composed of a symmetrical square wave, superimposed on a base
            staircase potential, is applied to the working electrode (8) (Figure 3-8). The current
            is sampled twice during each square-wave cycle, once at the end of the forward pulse
            (at t ) and once at the end of the reverse pulse (at t ). Since the square-wave
               1                                         2
            modulation amplitude is very large, the reverse pulses cause the reverse reaction of
            the product (of the forward pulse). The difference between the two measurements is
            plotted versus the base staircase potential. A dimensionless plot of the theoretical
            forward, reverse, and difference currents is given in Figure 3-9 for a rapid reversible
            redox system. The resulting peak-shaped voltammogram is symmetrical about the
            half-wave potential, and the peak current is proportional to the concentration.
            Excellent sensitivity accrues from the fact that the net current is larger than either
            the forward or reverse components (since it is the difference between them); the
            sensitivity is higher than that of differential pulse polarography (in which the reverse
            current is not used). Coupled with the effective discrimination against the charging
            background current, very low detection limits near 1   10  8  M can be attained.
            Comparison of square-wave and differential pulse voltammetry for reversible and
            irreversible cases indicated that the square-wave currents are 4 and 3.3 times higher,
            respectively, than the analogous differential-pulse response (10).


            FIGURE 3-8 Square-wave waveform showing the amplitude, E ; step height, DE; square-
                                                           sw
            wave period, t; delay time, T ; and current measurement times, 1 and 2. (Reproduced with
                                 d
            permission from reference 9.)