
Page 89 - Analytical Electrochemistry 2d Ed - Jospeh Wang
P. 89
74 CONTROLLED-POTENTIAL TECHNIQUES
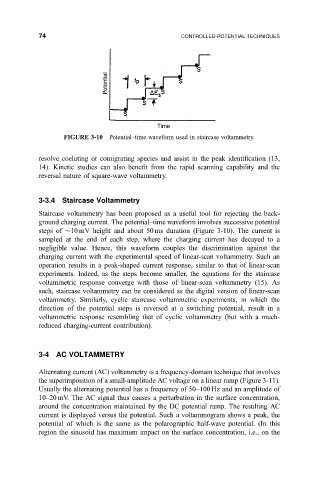
FIGURE 3-10 Potential±time waveform used in staircase voltammetry.
resolve coeluting or comigrating species and assist in the peak identi®cation (13,
14). Kinetic studies can also bene®t from the rapid scanning capability and the
reversal nature of square-wave voltammetry.
3-3.4 Staircase Voltammetry
Staircase voltammetry has been proposed as a useful tool for rejecting the back-
ground charging current. The potential±time waveform involves successive potential
steps of 10 mV height and about 50 ms duration (Figure 3-10). The current is
sampled at the end of each step, where the charging current has decayed to a
negligible value. Hence, this waveform couples the discrimination against the
charging current with the experimental speed of linear-scan voltammetry. Such an
operation results in a peak-shaped current response, similar to that of linear-scan
experiments. Indeed, as the steps become smaller, the equations for the staircase
voltammetric response converge with those of linear-scan voltammetry (15). As
such, staircase voltammetry can be considered as the digital version of linear-scan
voltammetry. Similarly, cyclic staircase voltammetric experiments, in which the
direction of the potential steps is reversed at a switching potential, result in a
voltammetric response resembling that of cyclic voltammetry (but with a much-
reduced charging-current contribution).
3-4 AC VOLTAMMETRY
Alternating current (AC) voltammetry is a frequency-domain technique that involves
the superimposition of a small-amplitude AC voltage on a linear ramp (Figure 3-11).
Usually the alternating potential has a frequency of 50±100 Hz and an amplitude of
10±20 mV. The AC signal thus causes a perturbation in the surface concentration,
around the concentration maintained by the DC potential ramp. The resulting AC
current is displayed versus the potential. Such a voltammogram shows a peak, the
potential of which is the same as the polarographic half-wave potential. (In this
region the sinusoid has maximum impact on the surface concentration, i.e., on the