
Page 92 - Analytical Electrochemistry 2d Ed - Jospeh Wang
P. 92
3-5 STRIPPING ANALYSIS 77
anodic scan, the amalgamated metals are reoxidized, stripped out of the electrode (in
an order that is a function of each metal standard potential), and a current ¯ows:
M
Hg! M n ne Hg
3-23
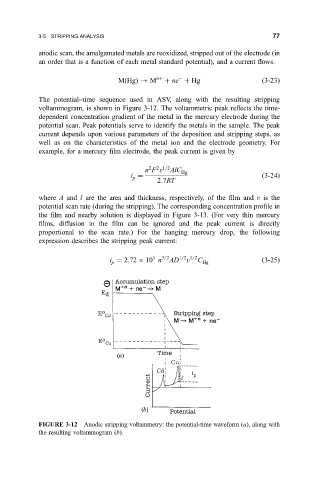
The potential±time sequence used in ASV, along with the resulting stripping
voltammogram, is shown in Figure 3-12. The voltammetric peak re¯ects the time-
dependent concentration gradient of the metal in the mercury electrode during the
potential scan. Peak potentials serve to identify the metals in the sample. The peak
current depends upon various parameters of the deposition and stripping steps, as
well as on the characteristics of the metal ion and the electrode geometry. For
example, for a mercury ®lm electrode, the peak current is given by
2
2 1=2
n F v AlC Hg
i
3-24
p
2:7RT
where A and l are the area and thickness, respectively, of the ®lm and v is the
potential scan rate (during the stripping). The corresponding concentration pro®le in
the ®lm and nearby solution is displayed in Figure 3-13. (For very thin mercury
®lms, diffusion in the ®lm can be ignored and the peak current is directly
proportional to the scan rate.) For the hanging mercury drop, the following
expression describes the stripping peak current:
5
i 2:72 10 n 3=2 AD 1=2 1=2 C Hg
3-25
v
p
FIGURE 3-12 Anodic stripping voltammetry: the potential-time waveform
a, along with
the resulting voltammogram
b.