
Page 83 - Analytical Electrochemistry 2d Ed - Jospeh Wang
P. 83
68 CONTROLLED-POTENTIAL TECHNIQUES
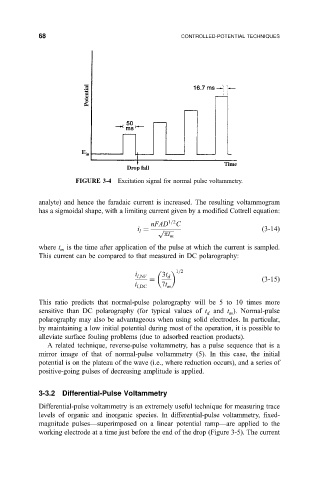
FIGURE 3-4 Excitation signal for normal pulse voltammetry.
analyte) and hence the faradaic current is increased. The resulting voltammogram
has a sigmoidal shape, with a limiting current given by a modi®ed Cottrell equation:
nFAD 1=2 C
i p
3-14
l
pt
m
where t is the time after application of the pulse at which the current is sampled.
m
This current can be compared to that measured in DC polarography:
i 3t 1=2
l;NF d
3-15
i 7t
l;DC m
This ratio predicts that normal-pulse polarography will be 5 to 10 times more
sensitive than DC polarography (for typical values of t and t ). Normal-pulse
d m
polarography may also be advantageous when using solid electrodes. In particular,
by maintaining a low initial potential during most of the operation, it is possible to
alleviate surface fouling problems (due to adsorbed reaction products).
A related technique, reverse-pulse voltammetry, has a pulse sequence that is a
mirror image of that of normal-pulse voltammetry (5). In this case, the initial
potential is on the plateau of the wave (i.e., where reduction occurs), and a series of
positive-going pulses of decreasing amplitude is applied.
3-3.2 Differential-Pulse Voltammetry
Differential-pulse voltammetry is an extremely useful technique for measuring trace
levels of organic and inorganic species. In differential-pulse voltammetry, ®xed-
magnitude pulsesÐsuperimposed on a linear potential rampÐare applied to the
working electrode at a time just before the end of the drop (Figure 3-5). The current