
Page 35 - Analytical method for food addtives
P. 35
6
%
CV 0.4–4.0
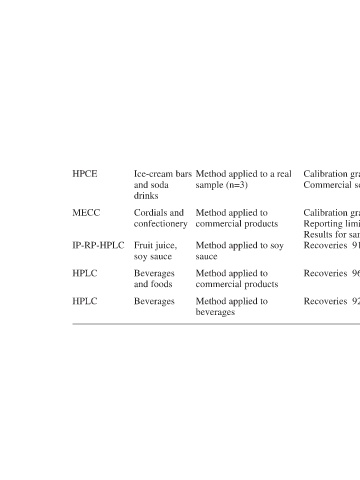
Calibration graph linear 18 (n=7) % RSD of migration time 0.49 (n=3) % RSD 3.81 µg/mL 9.34 Commercial soda drink: 19 % RSD 1.9–4.3 µg/mL Calibration graph linear up to 100 mg/kg Reporting limit 5 Results for samples compare with HPLC data for these samples 4 % CV 0.4–3.7 % Recoveries 91–113 5 % Re
%
Recoveries 92–108
Method applied to a real sample (n=3) Method applied to commercial products Method applied to soy sauce Method applied to commercial products Method applied to beverages
Ice-cream bars and soda drinks Cordials and confectionery Fruit juice, soy sauce Beverages and foods Beverages
HPCE MECC IP-RP-HPLC HPLC HPLC