
Page 30 - Analytical method for food addtives
P. 30
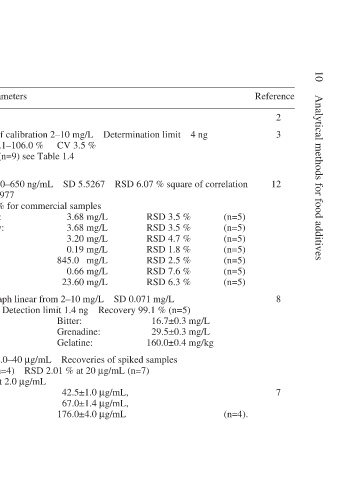
10  Analytical methods for food additives


                   Reference  2  3  12                   8                7


                                   % square of correlation   mg/L  mg/L  mg/kg


                          ng             (n=5)  (n=5)  (n=5)  (n=5)  (n=5)  (n=5)  (n=5)  (n=4).
                          4              %  %  %  %  %  %  %  % (n=5)  16.7±0.3  29.5±0.3
                          Determination limit  RSD 6.07  RSD 3.5  RSD 3.5  RSD 4.7  RSD 1.8  RSD 2.5  RSD 7.6  RSD 6.3  mg/L  SD 0.071  Recovery 99.1  160.0±0.4  Recoveries of spiked samples  µg/mL (n=7)  µg/mL,  µg/mL,  µg/mL


                          mg/L  CV 3.5 %  SD 5.5267  ng/mL  % for commercial samples  mg/L  3.68  mg/L  3.68  mg/L  3.20  mg/L  0.19  mg/L  845.0  mg/L  0.66  mg/L  23.60  mg/L  ng Detection limit 1.4  Bitter:  Grenadine:  Gelatine:  µg/mL  % at 20 RSD 2.01  42.5±1.0  67.0±1.4  176.0±4.0


                   Statistical parameters  see Table 1.3 Linear range of calibration 2–10 Recoveries 88.1–106.0 % Bitter sample (n=9) see Table 1.4  Linear range 50–650  coefficient 0.9977  RSD 1.8–7.6  Orange drinks:  Pineapple jelly:  Orange drink:  Honey sweet:  Colourant:  Fruit jelly:  Melon drink: Calibration graph linear from 2–10  % RSD 4.22


               Summary of statistical parameters for sunset yellow in foods


                   Extent of validation  Full collaborative trial  Performance of method established with standards (n=9) and validated with  real samples  Performance of method established and applied to 7 real samples (n=5)  Performance of method established with standards (n=9) and validated with commercial food products  Performance of method est


                   Matrix  Lemonade  Bitter  Soft drinks,  sweets, fruit  jellies  Commercial  products  Drinks


               Table 1.2  Method  IP-RP-HPLC  RP-HPLC  SP spectro-  photometry  IP-HPLC  HPIC